
This post was originally published by Deriv on 22 September 2022
A stock market index (or stock market indices if there is more than one) is a group of stocks used to measure the performance of a sector, stock market, or economy. A stock index usually consists of a set number of the top stocks of a particular exchange.
As a trader, understanding how to measure stock market indices is essential as it helps you assess the performance of a particular stock market, and through that, you can predict the pattern of stock market prices.
How are indexes weighted?
The most common way to read an index is to note the changes in its values over time.
In general, the value of a stock market index is based on the value of the individual stocks that make up that index. Because these prices change often, each stock market index is unique, and no two are entirely alike.
With different stocks and varying calculations, it is worth noting that every new stock market index has different starting values and should not be measured against each other.
In perspective, if one index goes up 300 points daily while the other goes up only 50, you may think the first index performed better than the second. However, if the first index was initially 50,000 while the second index started at 500, the second index had done better in percentage.
To analyse stock market indices, you should focus on the percentage of rise and fall instead of its point value, as a higher percentage gain means a more significant profit, while a higher percentage loss signifies a more considerable loss.
Note that most stock market indices do not measure the performance of the entire market but only show the general health of the sector, industry or economy they represent. Therefore, you can find out how each stock contributes to the index by understanding which stocks make up that particular index and how they are weighted.
Types of weighted index
There are 3 types of weighted indices, and they are categorised according to how the stocks influence the overall market index.
- Market capitalisation-weighted indices
- Equal weighted indices
- Price weighted indices
To properly read stock market indices, you’d need to know how much weight each stock would have on the index. There are separate ways of reading and analysing different weighted indices. This part will explore how each weighted index could be read.
Market capitalisation-weighted indices
Being the most common index weighting, market capitalisation-weighted indices consider stocks with a larger market capitalisation to have more influence and a more prominent weightage on the overall market index. These indices represent what a trader would earn if they purchased stocks of every company in the index.
Let’s look at an example index consisting of Company A, Company B, and Company C. Let’s say these companies have 7,500, 2,000, and 500 stocks, respectively, each priced at USD10, USD100, and USD500. In this example, Company A would have a lower market capitalisation at USD75,000, followed by Company B at USD200,000, leaving Company C with the highest market capitalisation at USD250,000.
If Company C’s stocks rise, it would have more of an impact on the value and percentage of the index compared to Company A having the same rise in stock prices. In the same way, if Company C’s stocks plummet, the value of this index will be more affected than if there were a massive decline in Company A’s stocks.
Equal weighted indices
As their name suggests, equal-weighted indices are affected equally by every company they consist of.
To find the value of this index, calculate the stock prices of each of these companies’ stocks by multiplying by the weight each company carries (calculated according to the number of companies in the index) and summing up to get the index value.

Looking back at the example above, there are 3 companies, meaning each would share one-third of the weight, or 33.3%, of each. Following this formula, the index value would be USD203.13.
Price weighted indices
Like market capitalisation-weighted indices, the value of price-weighted indices depends on the price of each stock. The difference is that with these indices, the price of each stock determines the percentage of influence it has on the index (with market capitalisation-weighted indices, the number of stocks the company has also influences the index).
Let’s look at the weightage of each company from the example above if they were price-weighted.
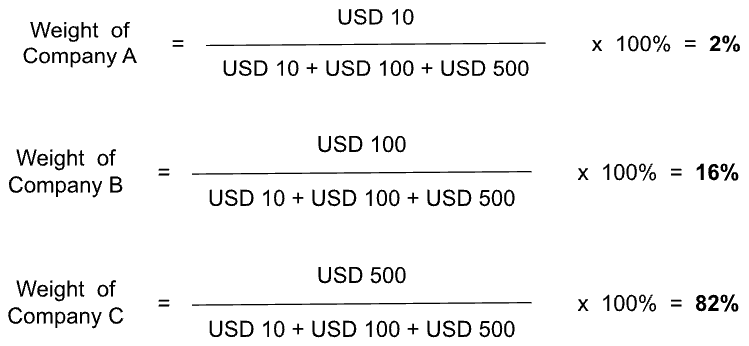
Based on the calculations above, the stocks in Company C would have more influence on the value of the index than those in Companies A and B.
Therefore, if there is a minor spike in Company C’s stock prices, it would have a more substantial effect on the overall stock index than a similar spike in Company A’s or B’s. On the other hand, a minor dip in Company C’s stock prices might have a similar effect on the index as a major dip in Company A’s stock prices.
Put this knowledge to the test by trading stock indices risk-free with our free demo account. You get 10,000 USD in virtual funds that can be reset if you run out. When you’re ready to trade, you can switch to a real account and trade your favourite indices on our platforms. Deriv MT5 offers CFD trading, while Deriv Bot and Deriv Trader allow you to trade options.
Disclaimer:
Options trading and the Deriv Bot platform are unavailable for clients residing within the EU.
The information contained within this blog article is for educational purposes only and is not intended as financial or investment advice.