
XAU/USD — Gold
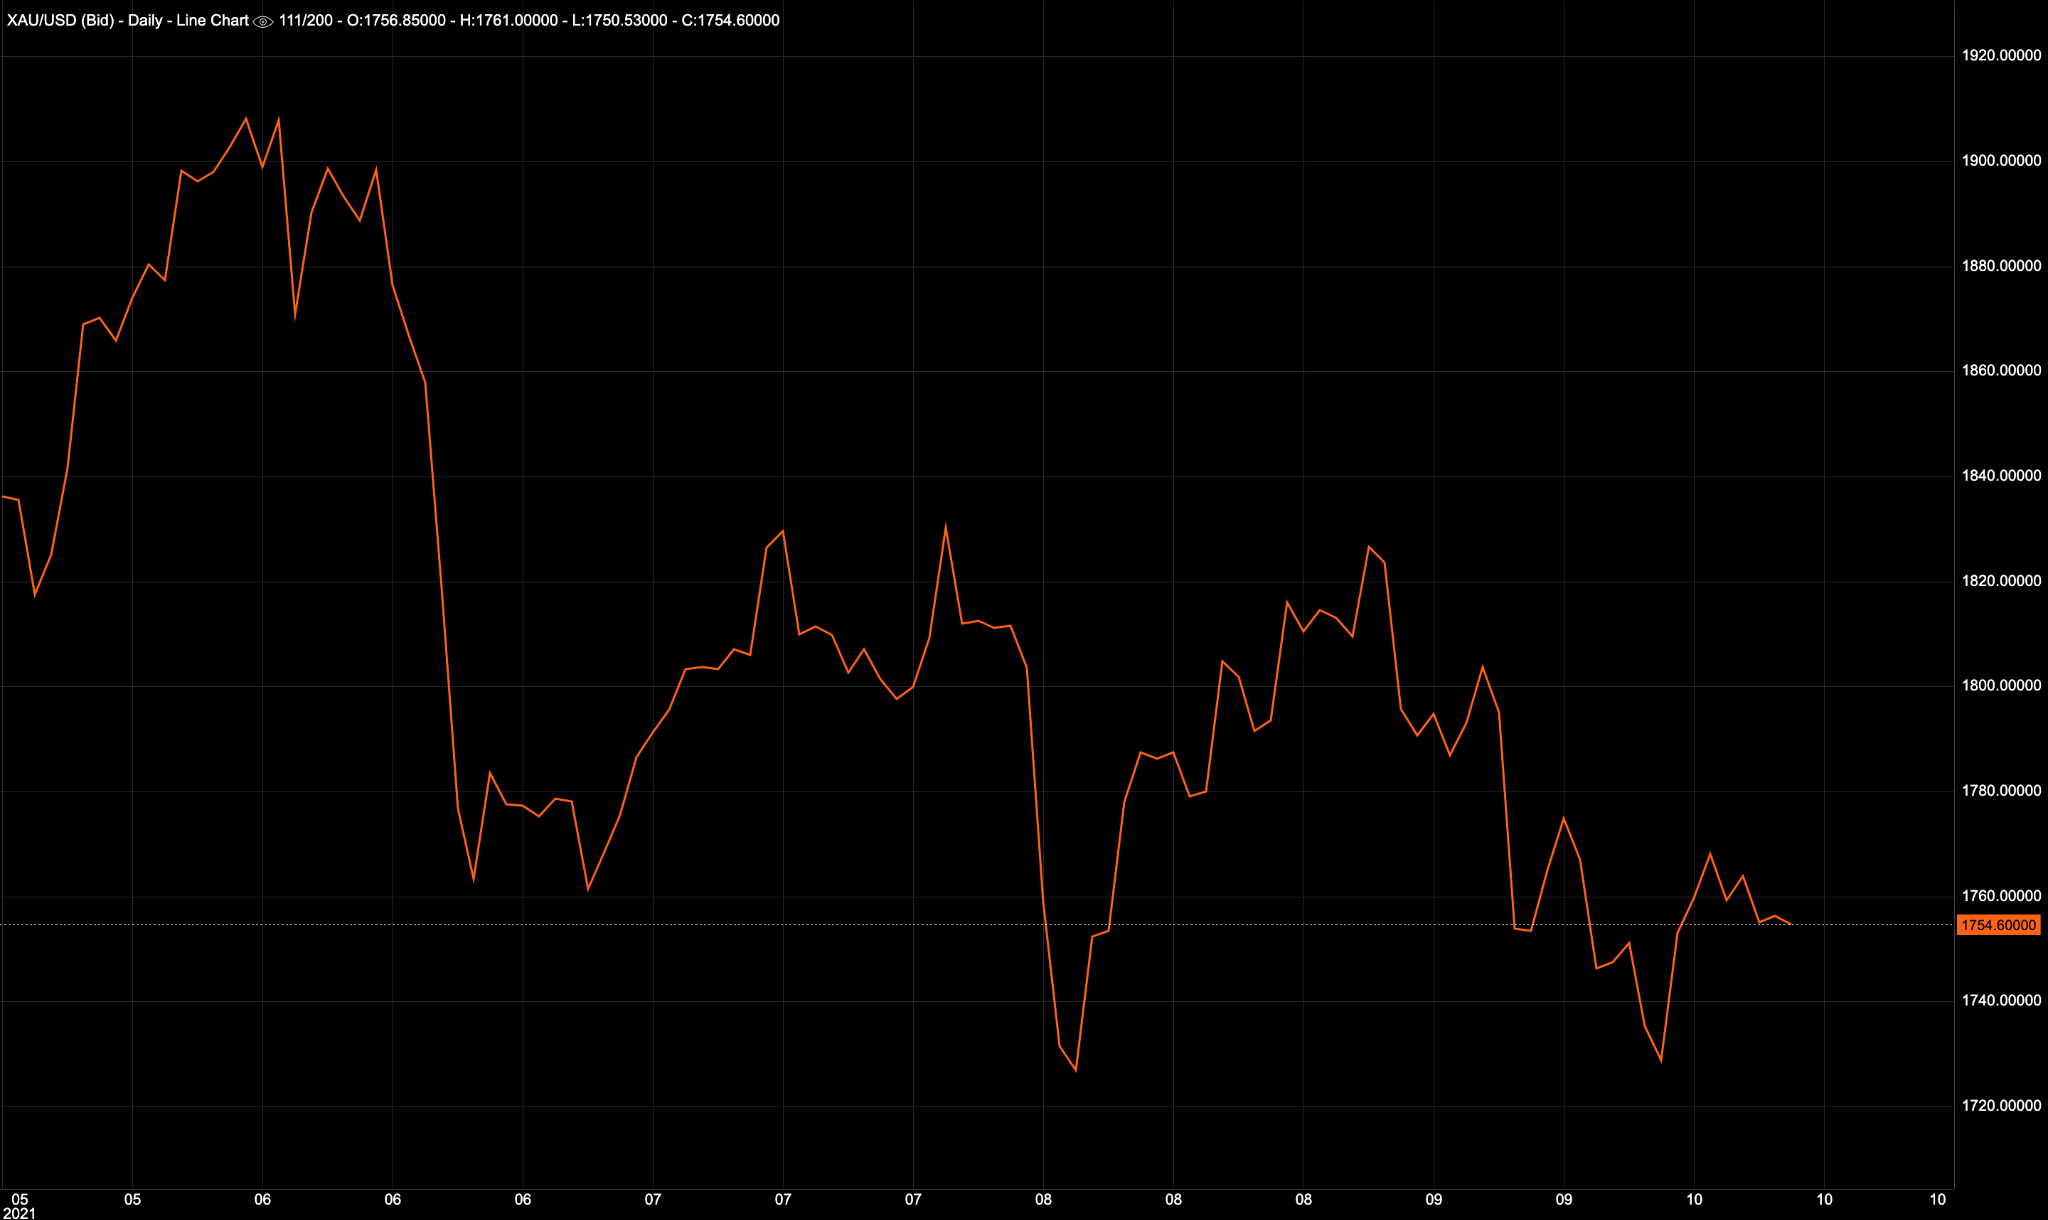
Last week, lower than expected employment data helped the gold prices rise to a level it hadn’t crossed in two weeks – $1,781. However, it failed to maintain momentum and fell back to $1,756. Prices of gold are taking a hit due to concerns of the US rate tapering and higher treasury yields. In the coming week, the market might react to the FOMC minutes and CPI data, releasing on Wednesday, 13 October 2021. This will be followed by m/m retail sales data on Friday, 15 October 2021. From a technical standpoint, gold’s resistance will be located between $1,764 – $1780 for the upcoming week. While on the downside, a 38.2% retracement level of $1,690 will act as the key support area, followed by a 23.6% retracement level of $1,600. According to the weekly and daily RSI, the index is currently trading at 43 and 45, respectively, implying further downside if the RSI breaks key support levels.
Trade Gold options on DTrader and CFDs on Deriv MT5 Financial account.
EUR/USD
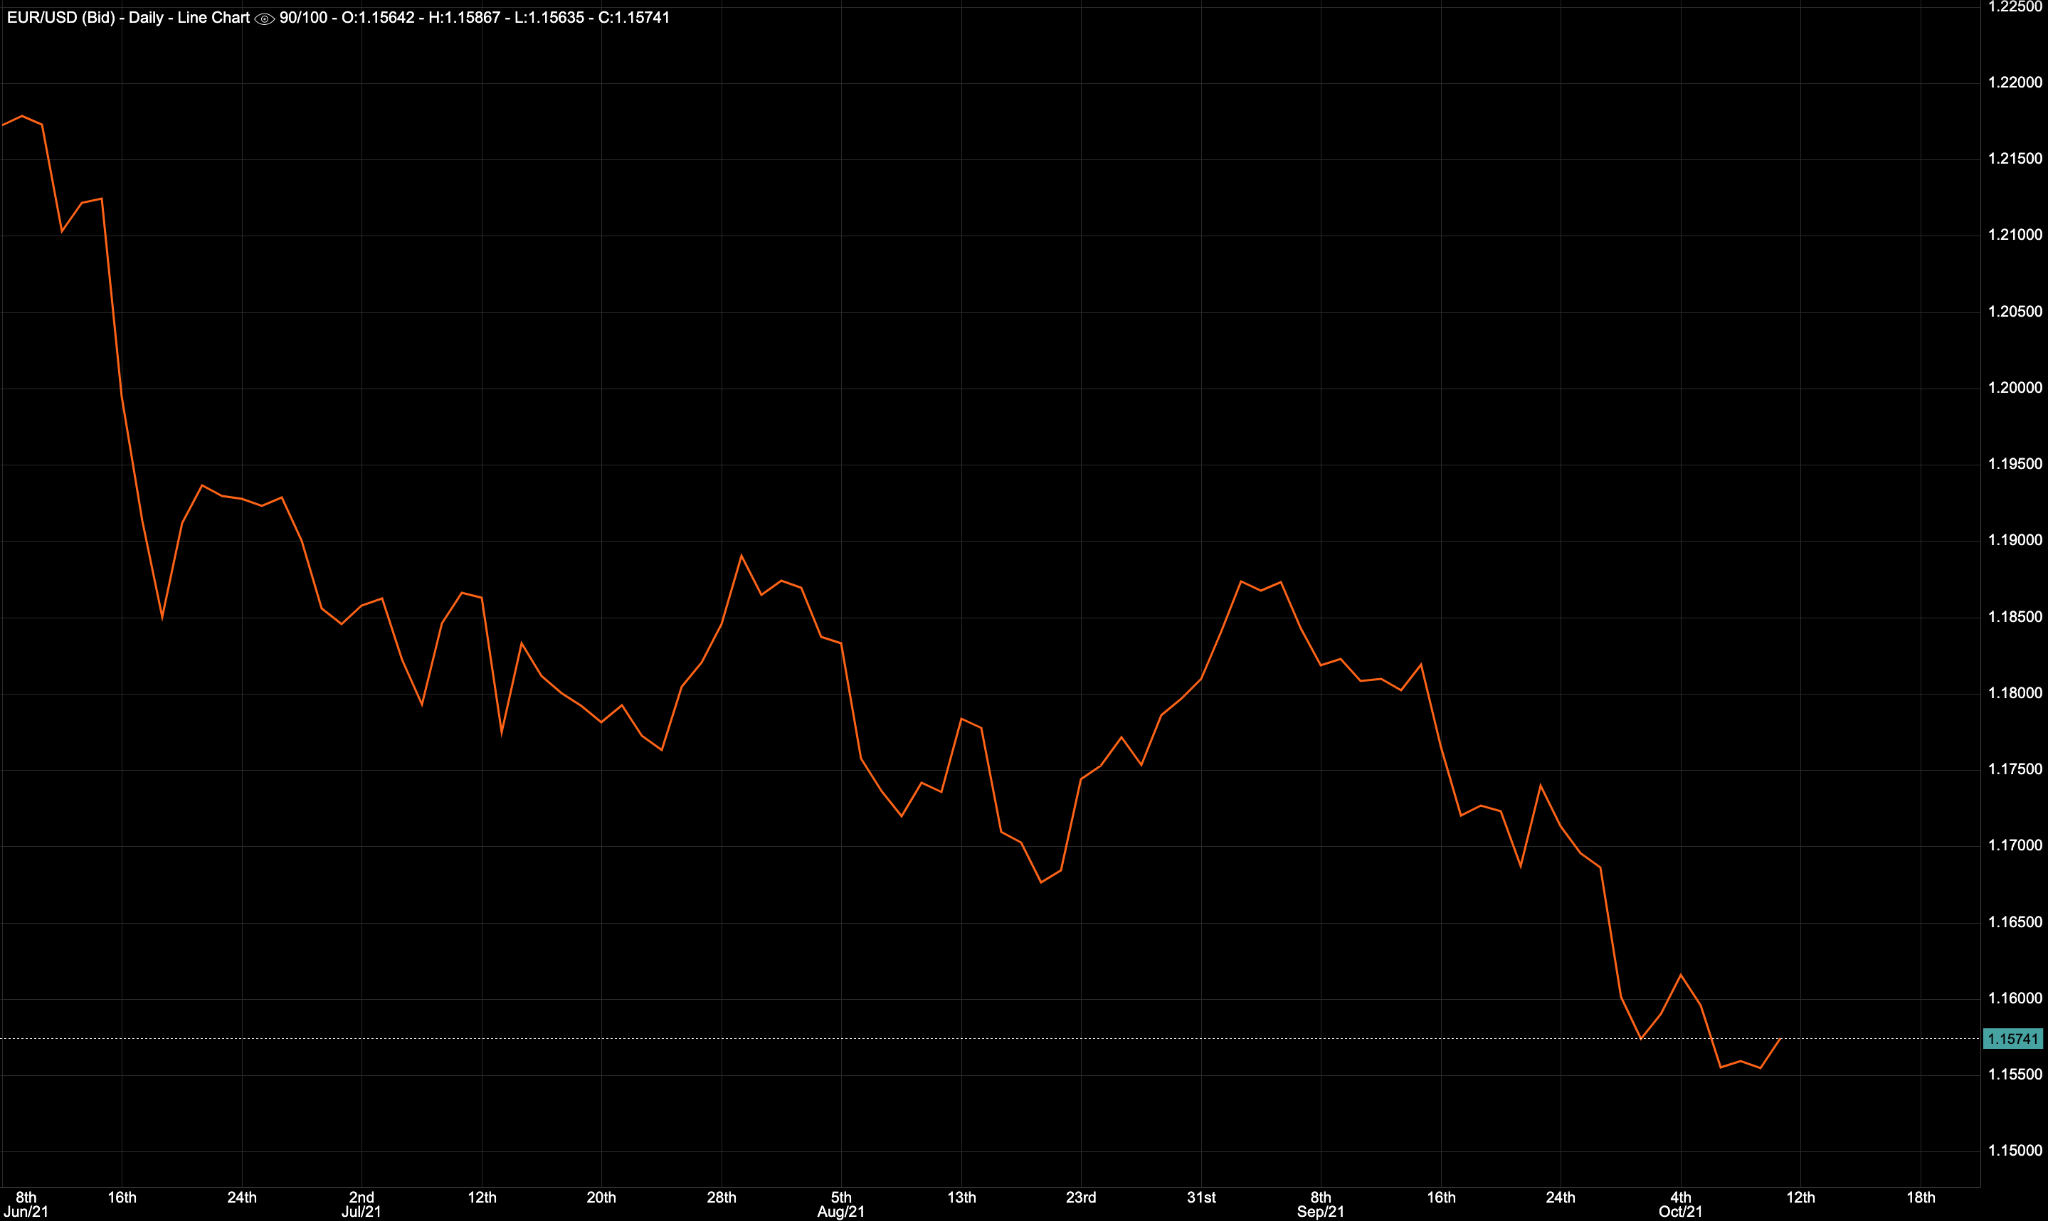
Earlier this week, EUR/USD broke through the key support area of 1.16 to make a new yearly low. Across Europe, economic data came in weaker than expected, affecting the EUR/USD pair. According to weekly charts, the pair is weak; however, on a daily chart, the RSI suggests a short-term retracement before the pair continues to decline. In terms of support, the prices could retrace to their previous 1.16 level, followed by a weekly 61.8% retracement level of 1.17. Below that, a 50% retracement level of 1.15 could provide some support.
Trade EUR/USD options on DTrader and CFDs on Deriv MT5 Financial and Financial STP accounts.
NASDAQ — 100
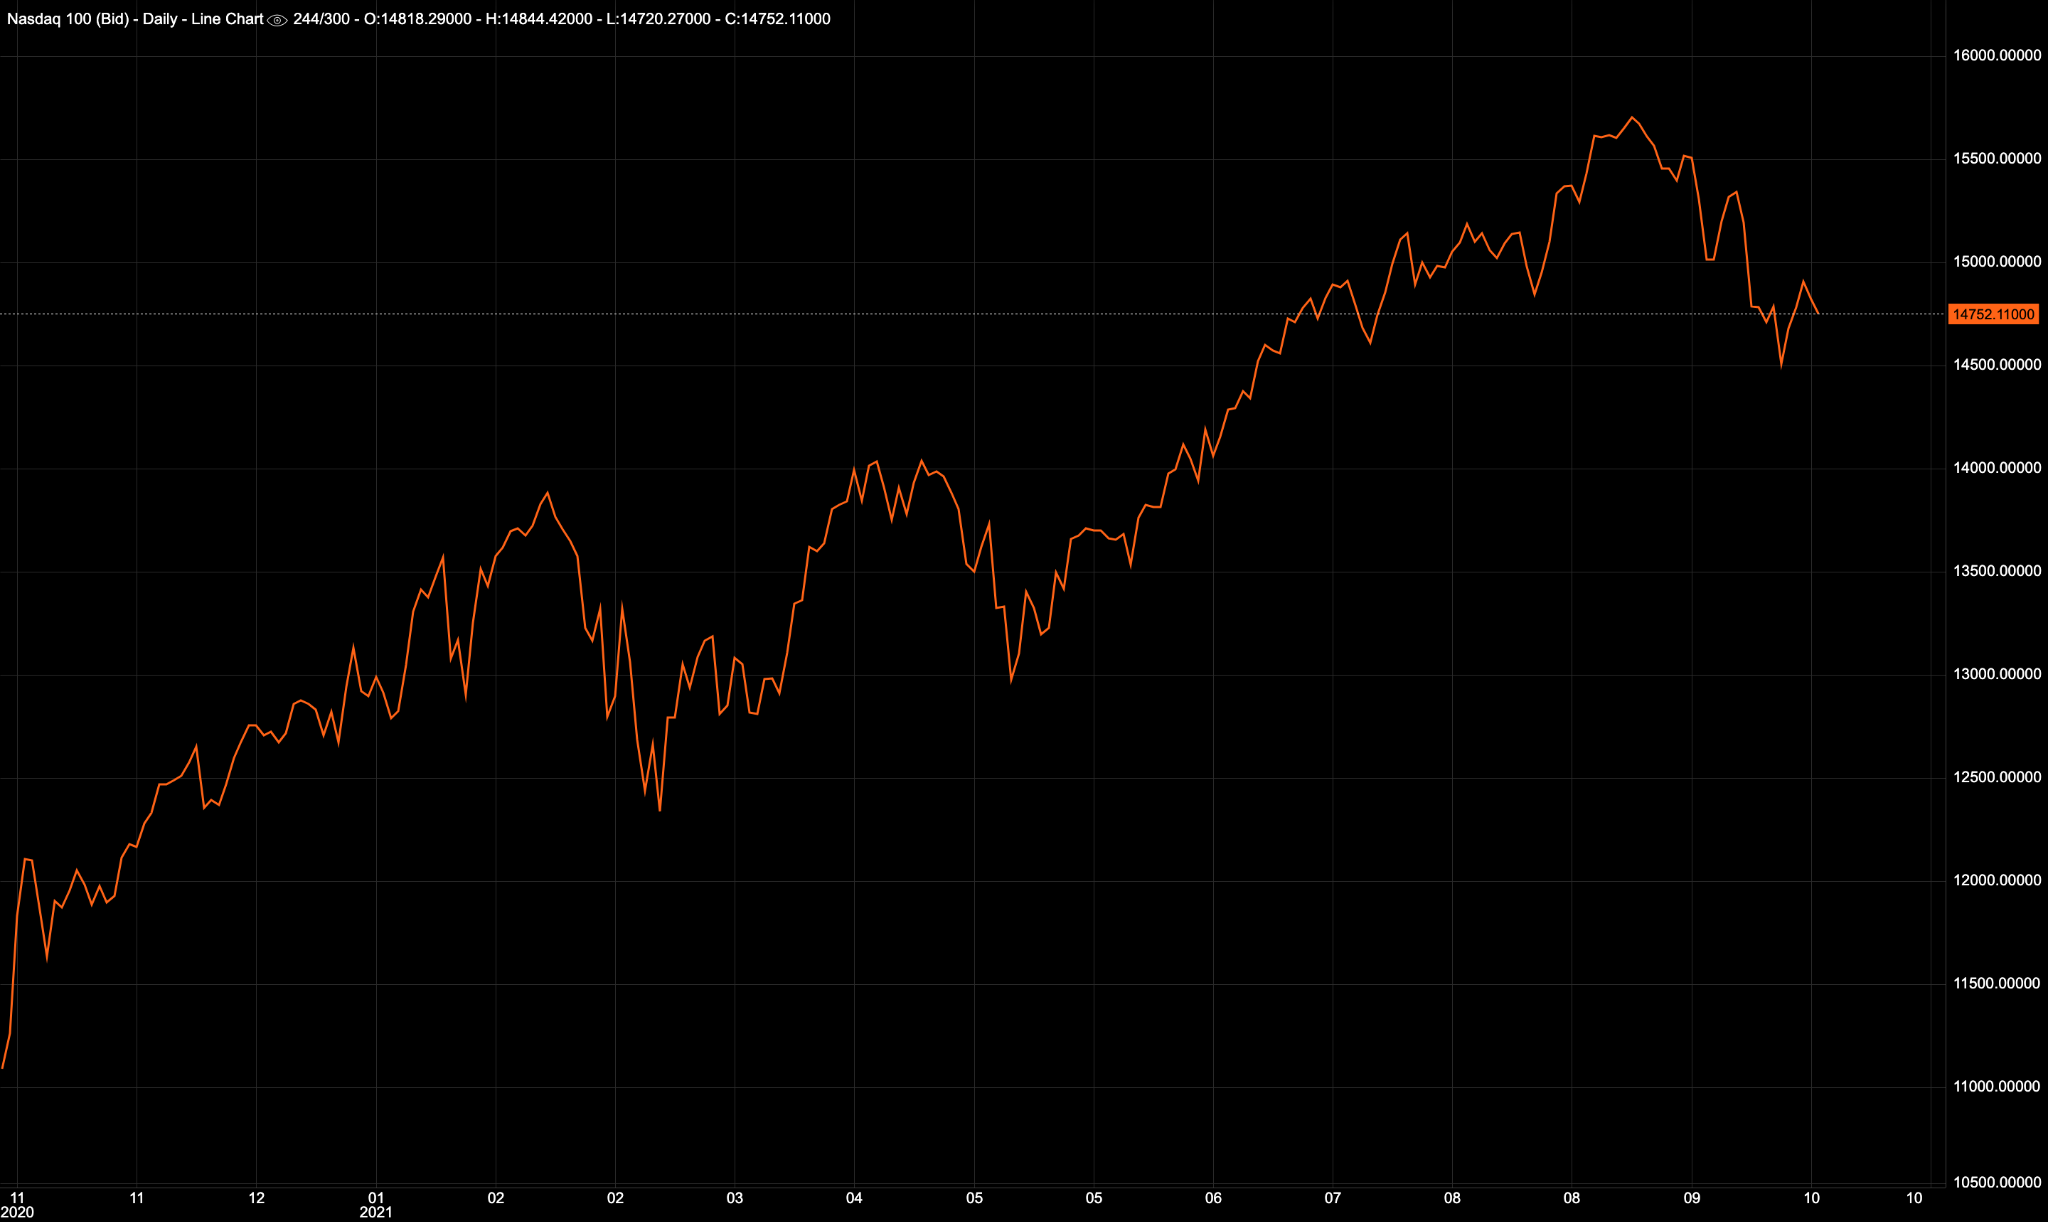
After a correction of almost 6% in the month of September, the US Tech Index is moving range bound. A rising US $ Index and the treasury yield is putting pressure on the equities. The upcoming FOMC minutes may help the Index determine its next move. In the short term, it has support near $14,400; any break below that might open the door for further declines to levels as low as $14,000. On the other hand, any sustained move above $15,000 could attract further bullish momentum.
Trade US Tech Index options on DTrader and trade CFDs on Deriv MT5 Financial accounts.
Disclaimer:
Options trading on stock indices, commodities, and forex on DTrader, are not available for clients residing within the European Union or the United Kingdom.