
The stock market is known for its ups and downs, and understanding and navigating these fluctuations is crucial for traders.
In this comprehensive guide, we will explore the concept of stock market volatility, its causes, and its impact on investment strategies. We will also provide practical insights and strategies to help you steer through the ever-changing market landscape.
What is stock market volatility?
Stock market volatility is a measure of how much the stock market’s overall value fluctuates up and down. It can also refer to the volatility of individual stocks. Volatility is commonly calculated using the statistical measure called standard deviation, which represents how much an asset’s price varies from its average price.
External events that create uncertainty often contribute to increased stock market volatility. For example, during the early days of the Covid-19 pandemic, the stock market experienced significant volatility, with major stock indexes rising and falling by more than 5% each day. This uncertainty led to frantic buying and selling as investors grappled with the unknown.
The year 2023 has brought unique challenges. With the S&P 500 and Nasdaq experiencing significant downturns, and amidst a backdrop of inflation and aggressive monetary policies by the Federal Reserve, understanding market dynamics is more critical than ever.
It’s important to note that volatility doesn’t measure the direction of stock price movements. Instead, it measures the size of the price swings. Volatility can be thought of as a measure of short-term uncertainty.
Types of volatility
There are two main types of volatility: historical volatility and implied volatility.
1. Historical volatility: Historical volatility is a measure of how volatile an asset was in the past. It provides insight into how much an asset’s price has fluctuated over a specific time period. Historical volatility can help traders understand the potential range of future price movements based on past performance.
2. Implied volatility: Implied volatility is a metric that represents how volatile traders expect an asset to be in the future. It is derived from the prices of put and call options. Implied volatility is often used in options pricing models, as it helps determine the market’s expectations of future price movements.
How do we measure stock market volatility?
There are several methods used to measure stock market volatility, including metrics specific to individual stocks and broader market indices.
1. Beta: Beta is a metric that measures a stock’s historical volatility relative to a benchmark index, such as the S&P 500. A beta of more than one indicates that a stock has historically moved more than the benchmark index. A beta of less than one implies a stock that is less reactive to overall market moves.
Source: Deriv; info adapted from Stooq.com and cboe.com
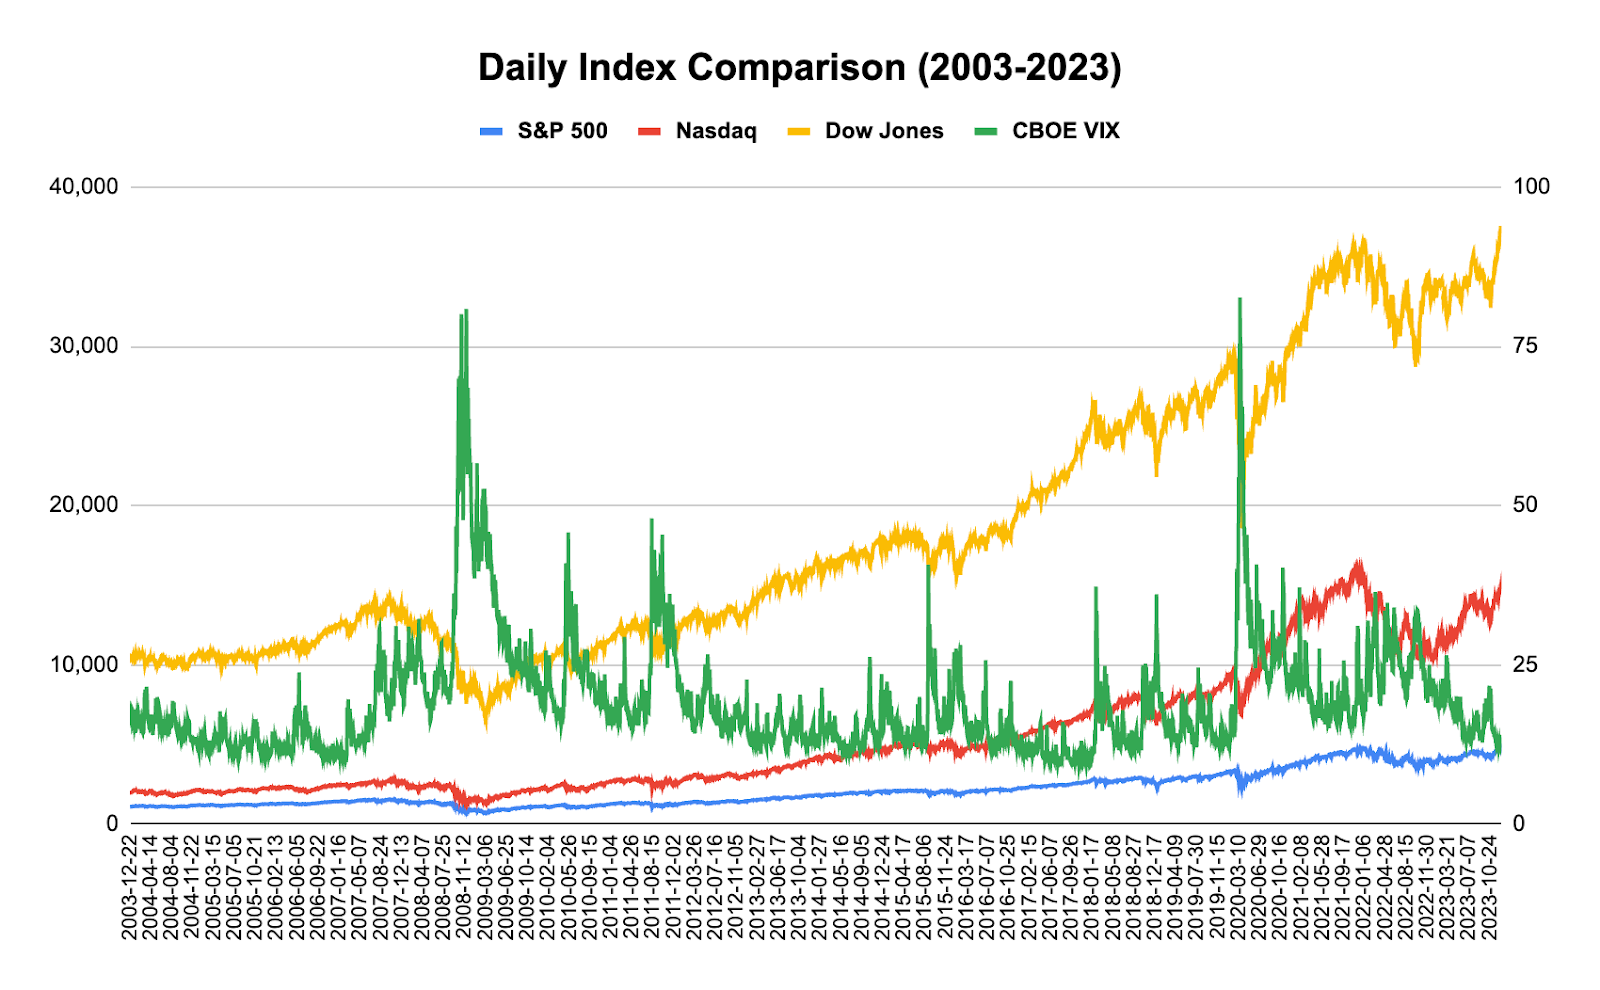
2. VIX (Volatility Index): The VIX, also known as the fear gauge, is a measure of the expected volatility in the stock market over the next 30 days. The VIX is calculated by the Chicago Board Options Exchange (CBOE) and is often used as an indicator of market sentiment. A significant increase in the VIX may indicate heightened fears and anticipation of large stock price movements.
Factors influencing volatility
Stock market volatility can be influenced by a combination of micro- and macro-economic factors. Understanding these factors can help traders anticipate and navigate periods of increased volatility.
1. Macroeconomic factors: Macroeconomic factors refer to broader economic conditions that can impact the stock market as a whole. These factors include:
- Shocks and uncertainties: Events such as economic downturns, policy changes, or global crises can create unpredictability and increase the probability of volatility.
- Monetary policy: Changes in interest rates, money supply, and inflation can influence market volatility.
- Political and societal events: Political instability, elections, or geopolitical tensions can create market uncertainty and volatility.
2. Microeconomic factors: Microeconomic factors relate to specific companies, industries, or sectors. These factors can influence the volatility of individual stocks or sectors. Examples include:
- Company-specific news: Earnings reports, mergers and acquisitions, or changes in management can impact a stock’s volatility.
- Industry-specific trends: Technological advancements, regulatory changes, or shifts in consumer behaviour can affect the volatility of certain industries.
Managing volatility in trading strategies
Volatility in the stock market can present both risks and opportunities for traders. Here are some strategies to consider when managing volatility in your trading portfolio:
- Diversification: Spread your trades across different asset classes to mitigate risks.
- Long-term trading: Focus on long-term growth potential rather than short-term fluctuations.
- Dollar-cost averaging: Trade a fixed amount regularly, regardless of market conditions.
- Rebalancing: Adjust your portfolio periodically to maintain your preferred risk level.
- Seek professional advice: A financial advisor can offer personalised guidance based on your goals and risk tolerance.
Stock market volatility is an inherent aspect of investing. Understanding the causes and impact of volatility can help you make informed trading decisions and develop strategies to navigate market fluctuations.
Remember that volatility and risk are not the same, and long-term traders should focus on the fundamental growth prospects of their trades rather than short-term price swings.
Sign up for a free Deriv demo account and practise measuring stock market volatility risk-free. The demo account comes with virtual funds so you can test these tips and determine which works best for you.
Disclaimer:
This information is considered accurate and correct at the date of publication. Changes in circumstances after the time of publication may impact the accuracy of the information.
Certain products may not be available in your country.
The information contained within this blog article is for educational purposes only and is not intended as financial or investment advice.
Trading is risky. Past performance is not indicative of future results. It is recommended to do your own research prior to making any trading decisions.