
Identifying chart patterns is a great way to do technical analysis because, despite the word ‘technical’, it doesn’t actually require any technical knowledge. All you need to do is intuitively identify a shape or pattern in your price chart and outline it.
According to studies, our eyes tend to look for patterns everywhere, so finding one in a price chart is quite easy. But it is important to understand the concept of support and resistance trend lines first, as they define almost all the chart patterns.
What are trend lines?
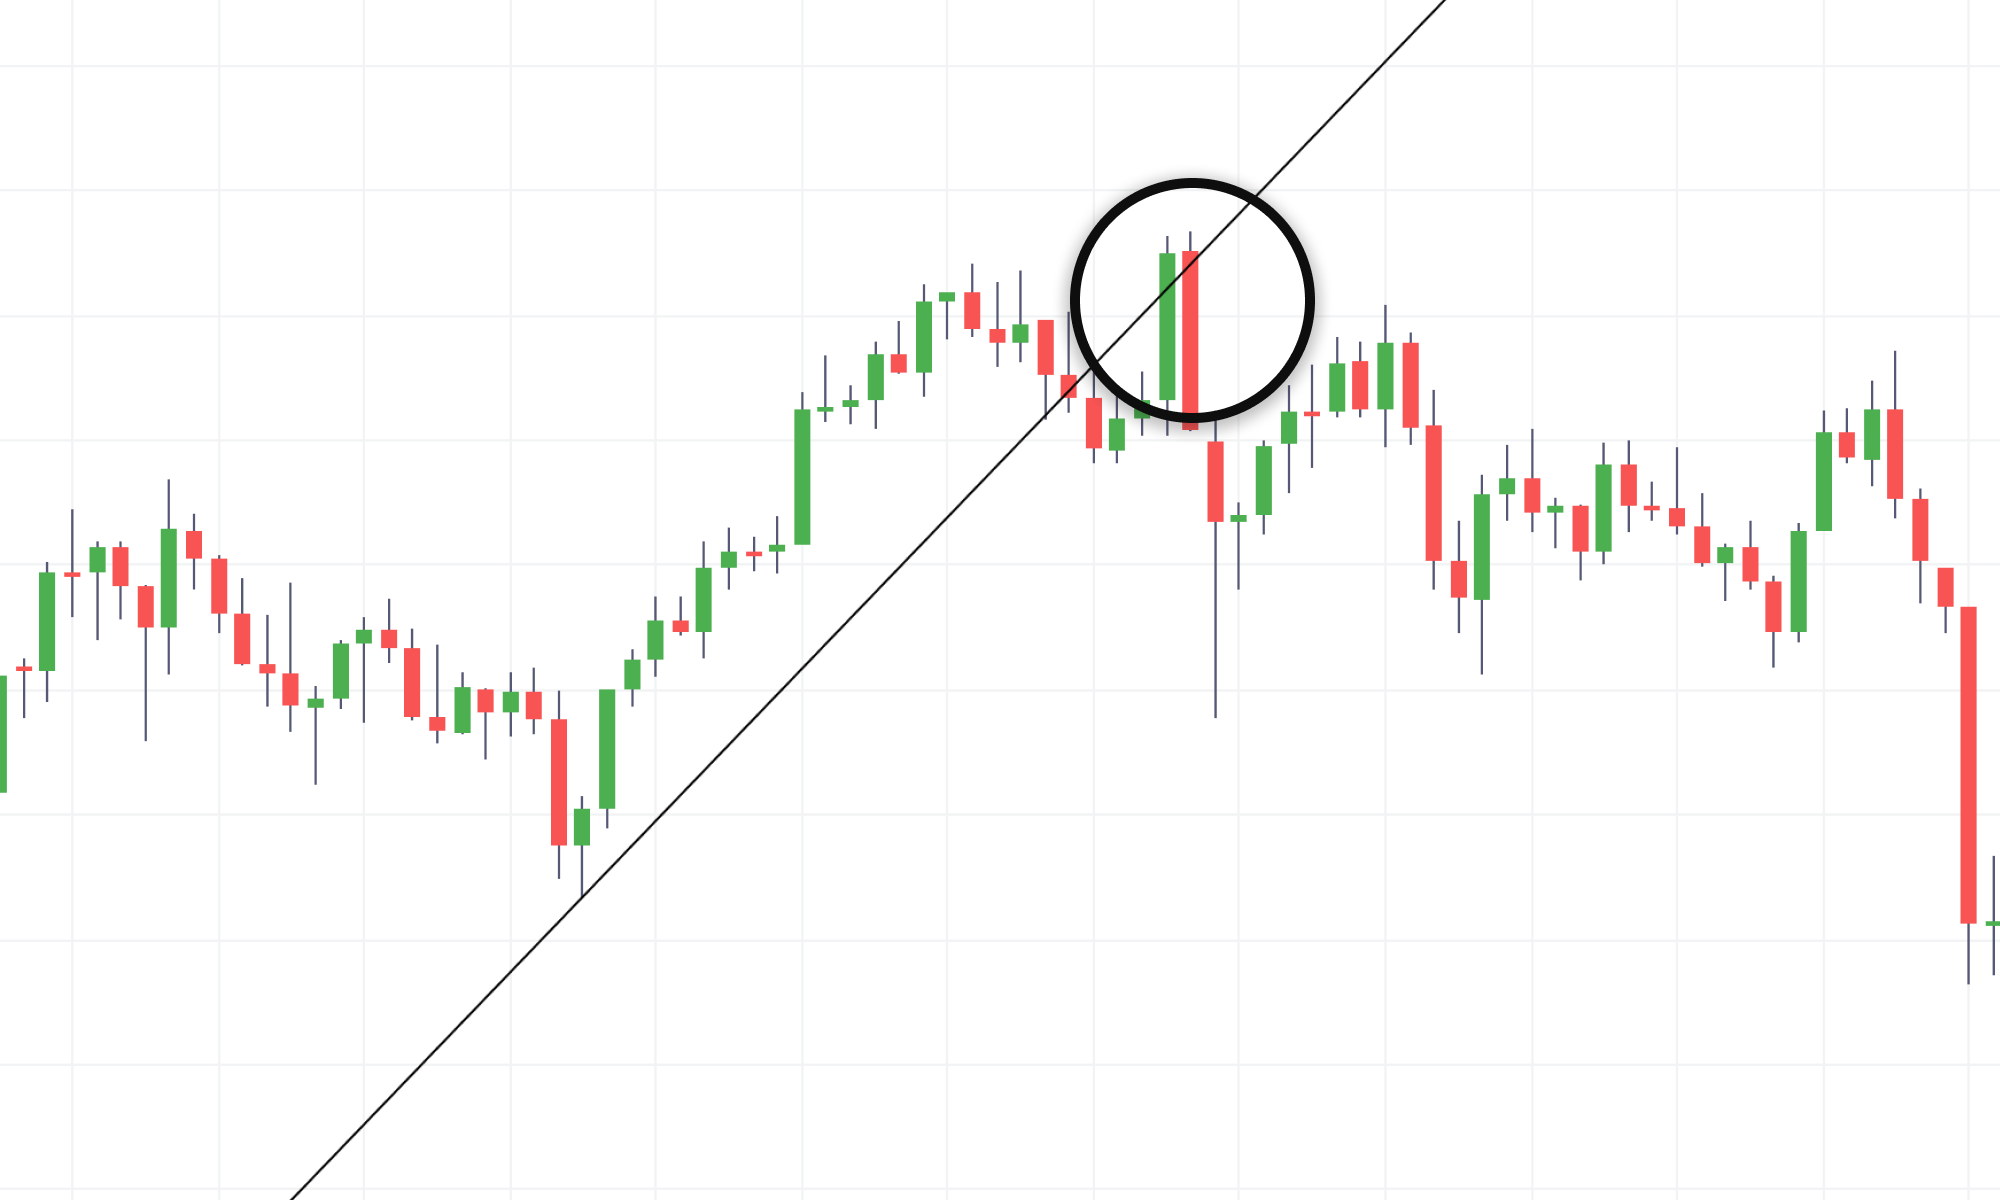
A trend line in a price chart is a line that connects a few price points of your selection, e.g. the opening prices within the past week or month. Whenever the price crosses this line, it’s called a breakout, and that’s when a new trend is usually formed. The breakout serves as a signal to place a trade.
Support and resistance are arguably the most widely used trend lines in trading.
What are support and resistance trend lines?
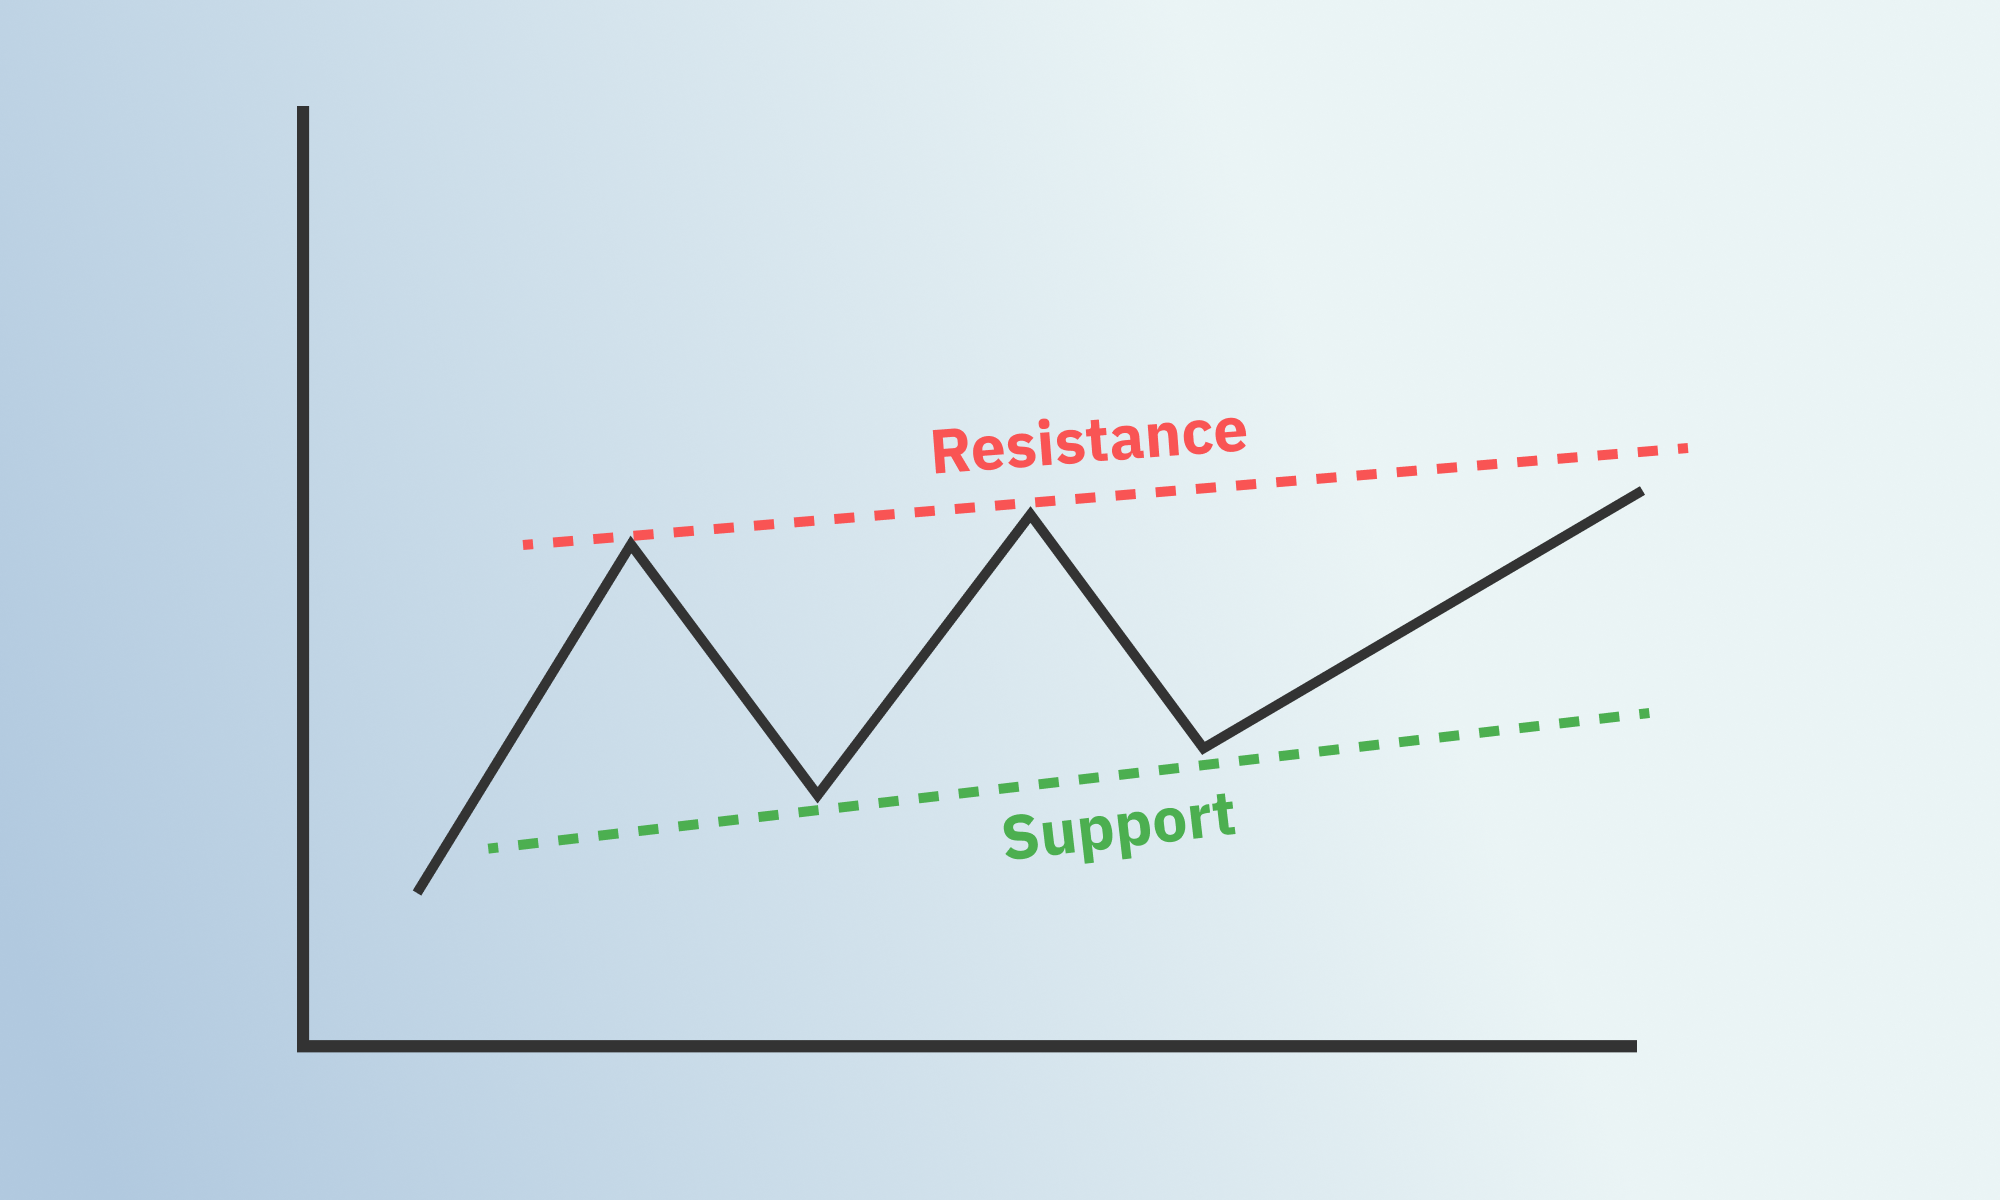
Support and resistance trend lines represent levels that act as barriers where the price tends to stop moving forward. Support is the bottom price level where the downtrend meets support and stops falling. And resistance is the top level where the uptrend meets resistance and stops rising.
Like almost everything else in trading, support and resistance are influenced by supply and demand. Here is how it works.
Let’s say the price of gold has been gradually decreasing over the past few days. As you probably know, the price goes down when traders sell an asset in large quantities, and supply starts exceeding demand.
But there is a group of people who want to buy gold when it’s as cheap as 50 USD per gram, for example. Once they start buying it at 50 USD, the demand will increase, exceeding supply, and the price will start going up again.
So the price dropped to 50 USD, bounced off, and started going up again. The 50 USD price level is the support in this case.
Resistance is essentially the same process but reversed. Let’s say some people missed the opportunity to buy gold at 50 USD, and they are willing to pay more, but only as much as 100 USD. As soon as the price reaches 100 USD, they will stop buying it, the demand drops, and the price stops increasing. The100 USD price level will act as resistance in this case.
In trading, the price quite often forms a trend, bouncing between the same support and resistance price levels. But eventually, after reaching one of these levels, the price doesn’t bounce back and keeps moving in the same direction (falling below 50 USD or rising above 100 USD in our example), that’s when a breakout occurs. That’s exactly why you need trend lines and chart patterns – to catch the moment it happens.
What are drawing tools?
To help you visualise and define trend lines in your price chart, trading platforms are usually equipped with drawing tools. For example, here are the drawing tools on DTrader.
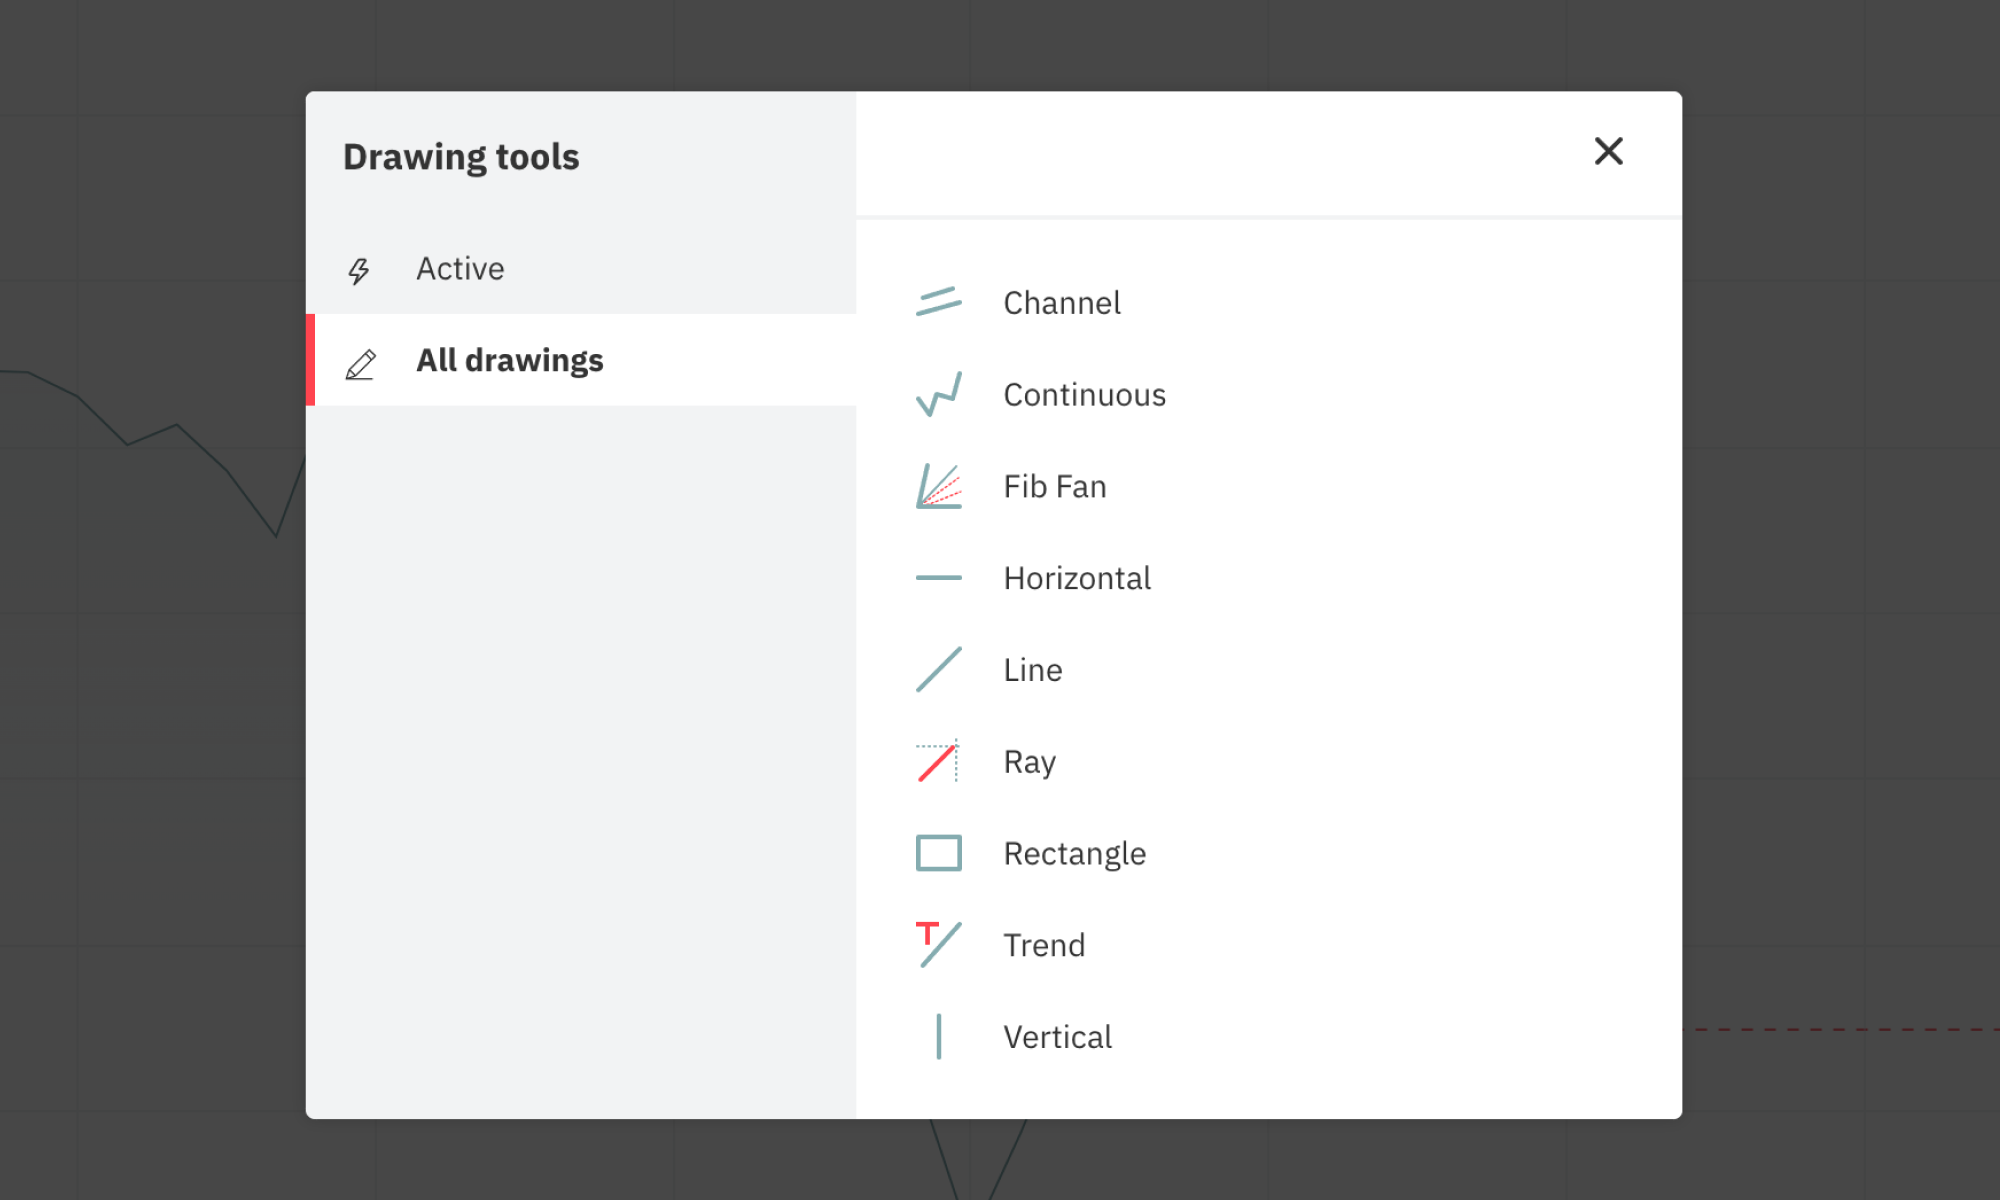
You can use any of them to draw right over your price chart and delete the drawings whenever you want. If you’re a beginner, the ‘Line’ tool is the easiest to use, since it’s the most straightforward way to draw trend lines.
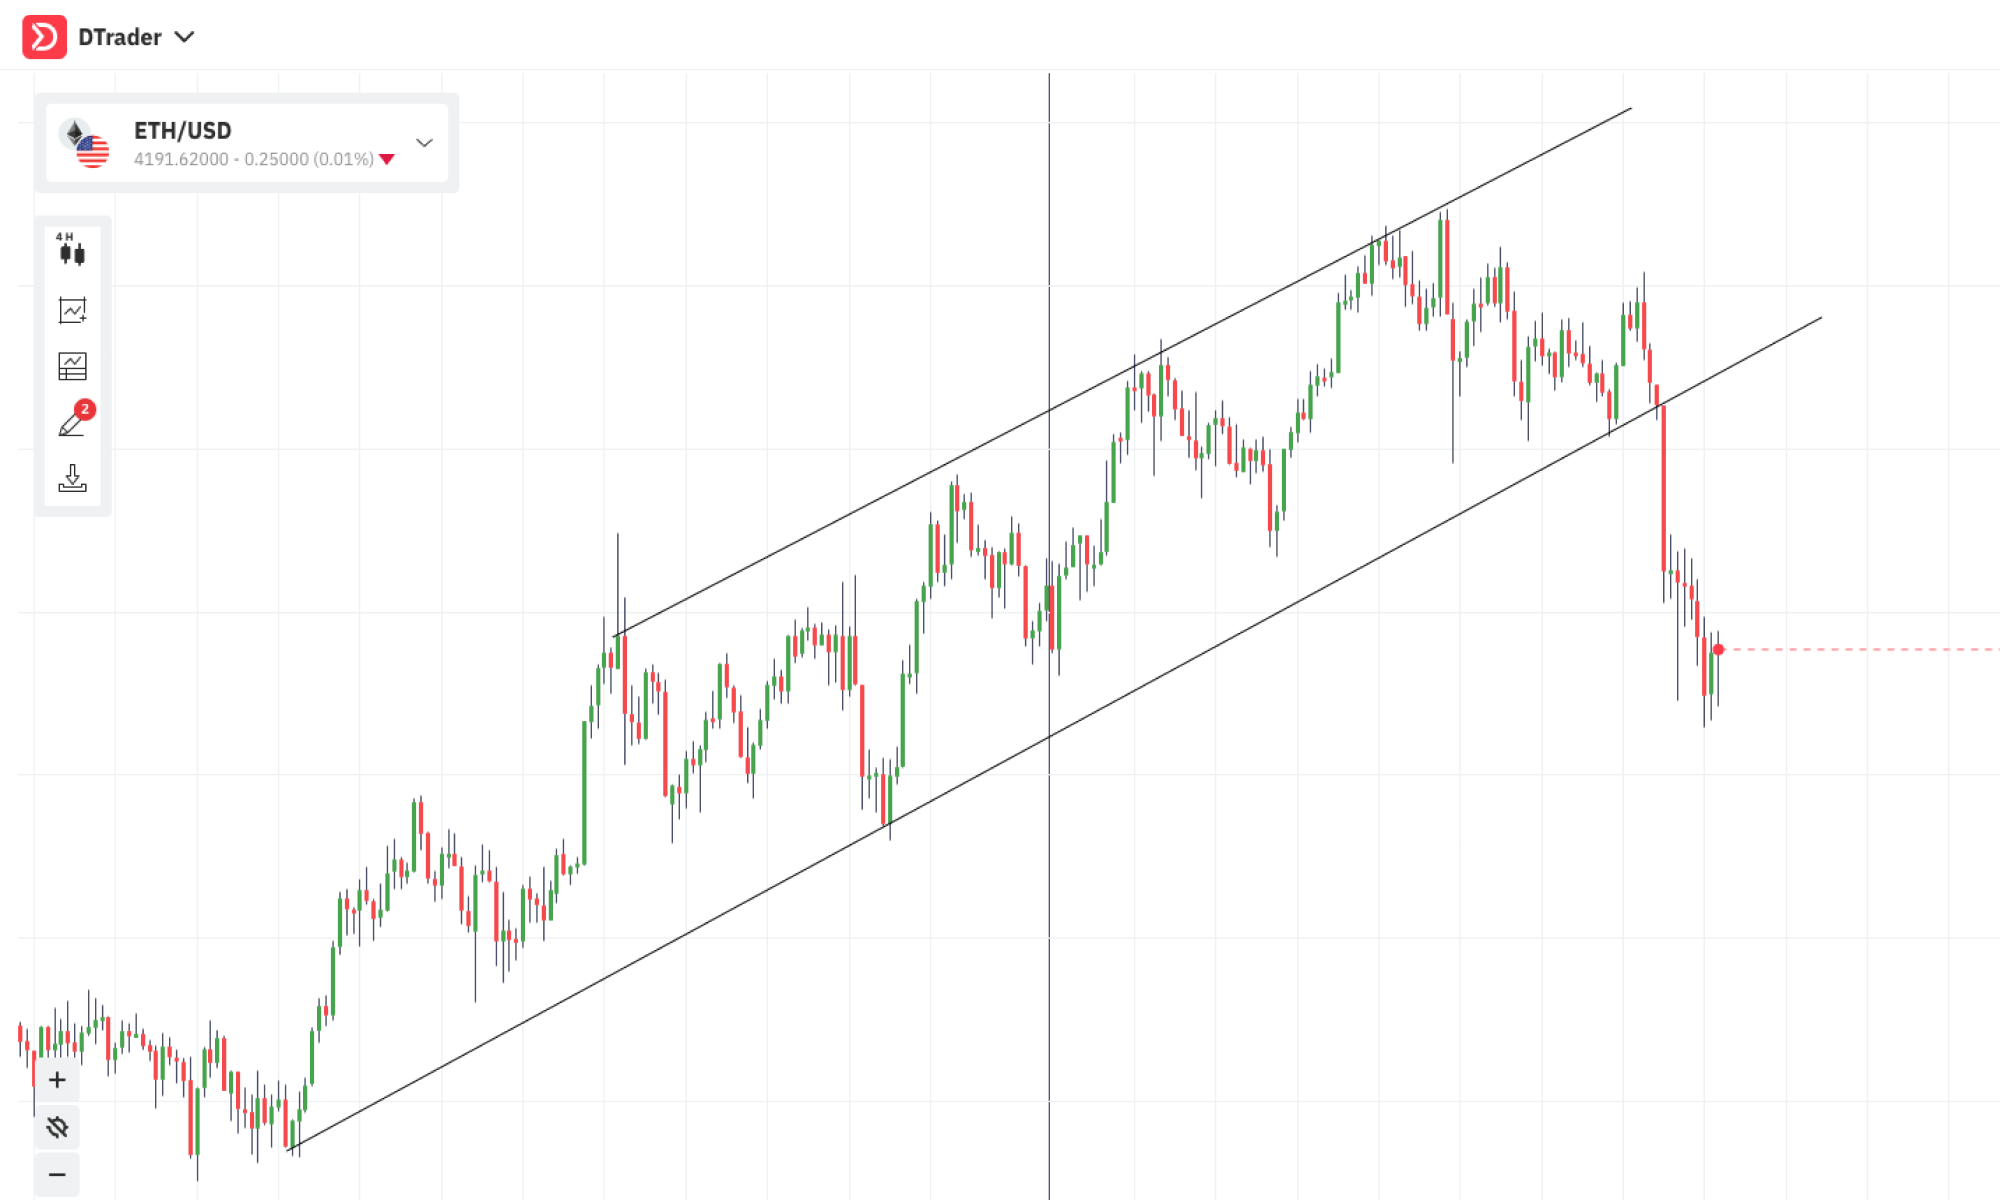
For example, here are the support and resistance trend lines made with the help of ‘Line’ drawing tool.
Trading on support and resistance trend lines can be a strategy on its own. But creating chart patterns with the help of these two trend lines and some additional ones tends to give more accurate predictions, increasing your chances of success.
In our next blog, “Most common chart patterns in technical analysis“ we will cover the chart patterns in detail.
Meanwhile, while we walk you through the details of technical analysis, you can also practice applying your newly obtained knowledge, like finding and drawing trend lines, in a demo account.