Introducing TradersView for market analysis
Explore AI market summaries, chart analysis, news, and economic events with TradersView.
By the Deriv desk · 12 June 2026 · 6 min read

There is no shortage of market data. Prices, charts, headlines, and numbers are everywhere, and most of them are free. The harder question is what any of it actually means. Is gold rising for a reason that matters? Is the dollar moving on news that will last, or noise that will fade?
TradersView is built to answer that.
TradersView is Deriv's public financial market analysis experience for traders. It brings AI market summaries, chart analysis previews, economic events, and trending financial news into one place to help you analyse what is happening across key markets.
Whether you follow forex, commodities, cryptocurrencies, or global indices, TradersView gives you a clearer way to explore market movement and context.
Key takeaways
- TradersView is available to public visitors before login.
- It helps you understand what is moving in financial markets and why.
- AI market summaries explain market movement.
- Chart analysis previews give a quick read on trend, key levels, momentum, and volatility.
- The economic calendar helps you follow scheduled events that may affect markets.
- Trending news helps connect market movement with wider financial developments.
Understand what is happening in the market
Markets can be difficult to read when information is spread across charts, news feeds, calendars, and separate analysis tools.
TradersView brings these signals together so you can build a clearer picture of current market conditions. You can use it to review market movement, understand sentiment, follow trending assets, and explore the latest developments influencing financial markets.
It is not designed to tell you what to trade. It is designed to help you understand the market more clearly.
Start with an AI market summary
Charts can show you that a market has moved. TradersView helps explain what may be behind the move.
The AI market summary gives you a view of what is moving a market and why, bringing together market drivers, sentiment, and broader developments into a single explanation. Instead of leaving you to interpret price action alone, it connects market movement with the context around it, such as recent news, sentiment, and broader financial developments.
It is the difference between seeing that gold is up and understanding what may be driving the move.
For newer traders, it makes market activity easier to follow. For more experienced traders, it offers a faster way to scan the market before deciding where to focus next.
Source: TradersView
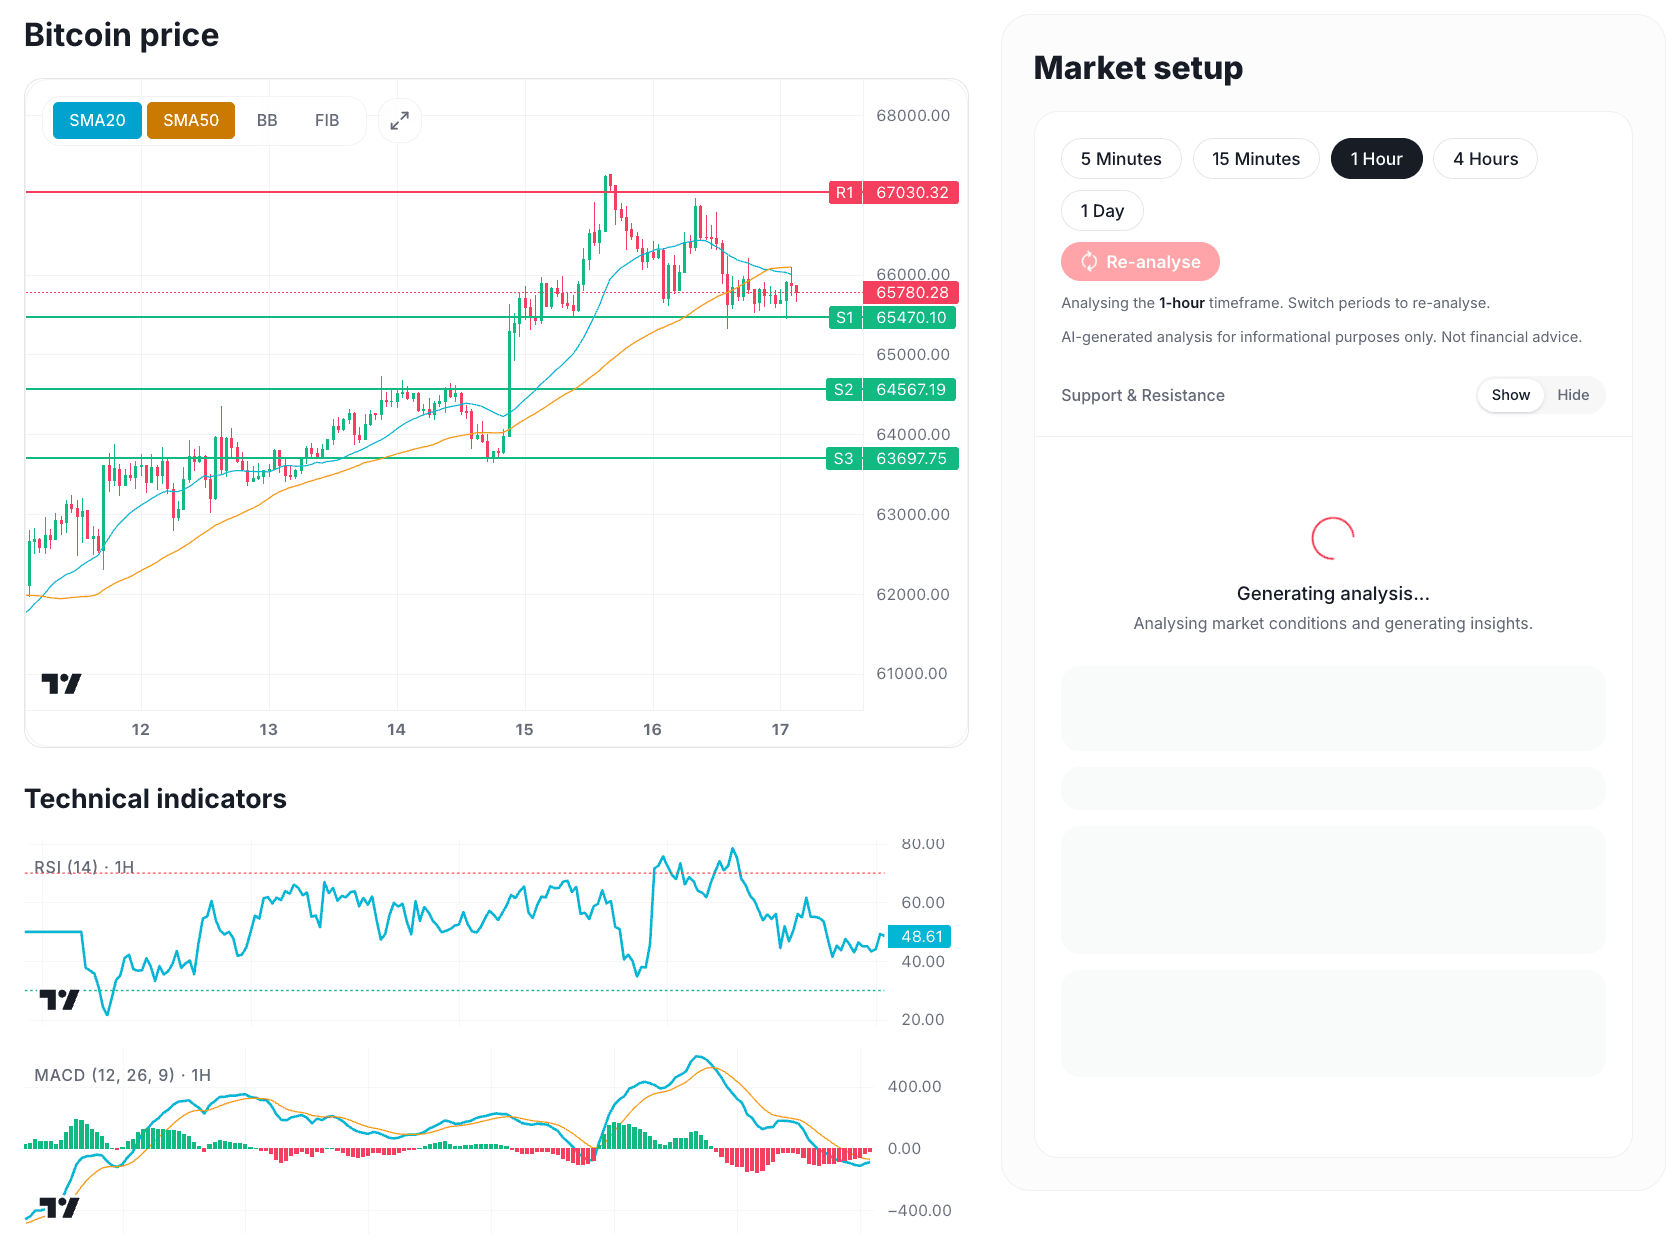
Preview the technical picture
When you want to look closer at an instrument, TradersView gives you a chart analysis preview that summarises the technical picture.
You get a quick read on trend direction, key price levels, momentum, and volatility, helping you assess the technical picture without poring over indicators yourself.
This makes it easier to orient yourself before doing deeper analysis. You can use the preview to understand the current setup, identify important levels, and decide whether a market is worth watching more closely.
The analysis is informational and educational. It does not predict outcomes or provide personalised trading advice.
Follow key economic events
Economic events can influence market volatility, especially in forex, commodities, crypto, and global indices.
The economic calendar in TradersView helps you stay aware of scheduled events that may affect financial markets, such as inflation data, central bank decisions, employment reports, and other macroeconomic releases.
By checking the calendar, you can better understand when major events are approaching and how they may connect to the markets you are watching.
Keep up with trending market news
Markets are shaped by more than price movement alone.
TradersView also gives you access to trending financial news, helping you follow the events and developments that may be influencing market sentiment and price action.
This helps connect the dots between what is happening on the chart and what is happening in the wider financial world.
Why use TradersView?
TradersView is built for traders who want a faster, clearer way to analyse financial markets.
You can use it to:
- Review AI market summaries
- Explore chart analysis previews
- Follow trending financial news
- Track economic events
- Understand market context before logging in
- Explore financial markets in one public experience
It gives you a clearer starting point before deciding which market or instrument to explore next. For anyone who has been put off by tools that simply push signals, this is the difference between being handed a verdict and being given the means to reach your own.
Try TradersView today
The best way to understand TradersView is to open it. Pick a market you already follow — gold, a major currency pair, an index, or a crypto asset — and read what is moving it, what the charts are saying, and what is coming up on the calendar.
Try it today and see how TradersView can be your starting point for clearer market understanding.
```