
The most expensive market in 155 years isn't a sell signal
A record valuation shapes the returns you collect over the next several years, not the price next quarter. So the S&P 500 sitting near its priciest
By the Deriv desk · 31 July 2026 · 3 min read

A record valuation shapes the returns you collect over the next several years, not the price next quarter. So the S&P 500 sitting near its priciest reading in 155 years is not a reason to sell. It is a reason to expect thinner rewards for the years you hold.
On the Shiller CAPE ratio, a price measure that smooths earnings over a decade, the index sits close to its most expensive reading since records began. The only time it stood higher was December 1999, at the peak of the dot-com bubble.
That sounds like a sell signal. It is not. Valuation is a gravity signal, not a timing signal.
Why an expensive market can keep rising
Overpaying for the same future earnings lowers your expected long-run return. That is arithmetic, not opinion. Pay more today for a fixed stream of profits, and each future dollar buys you less.
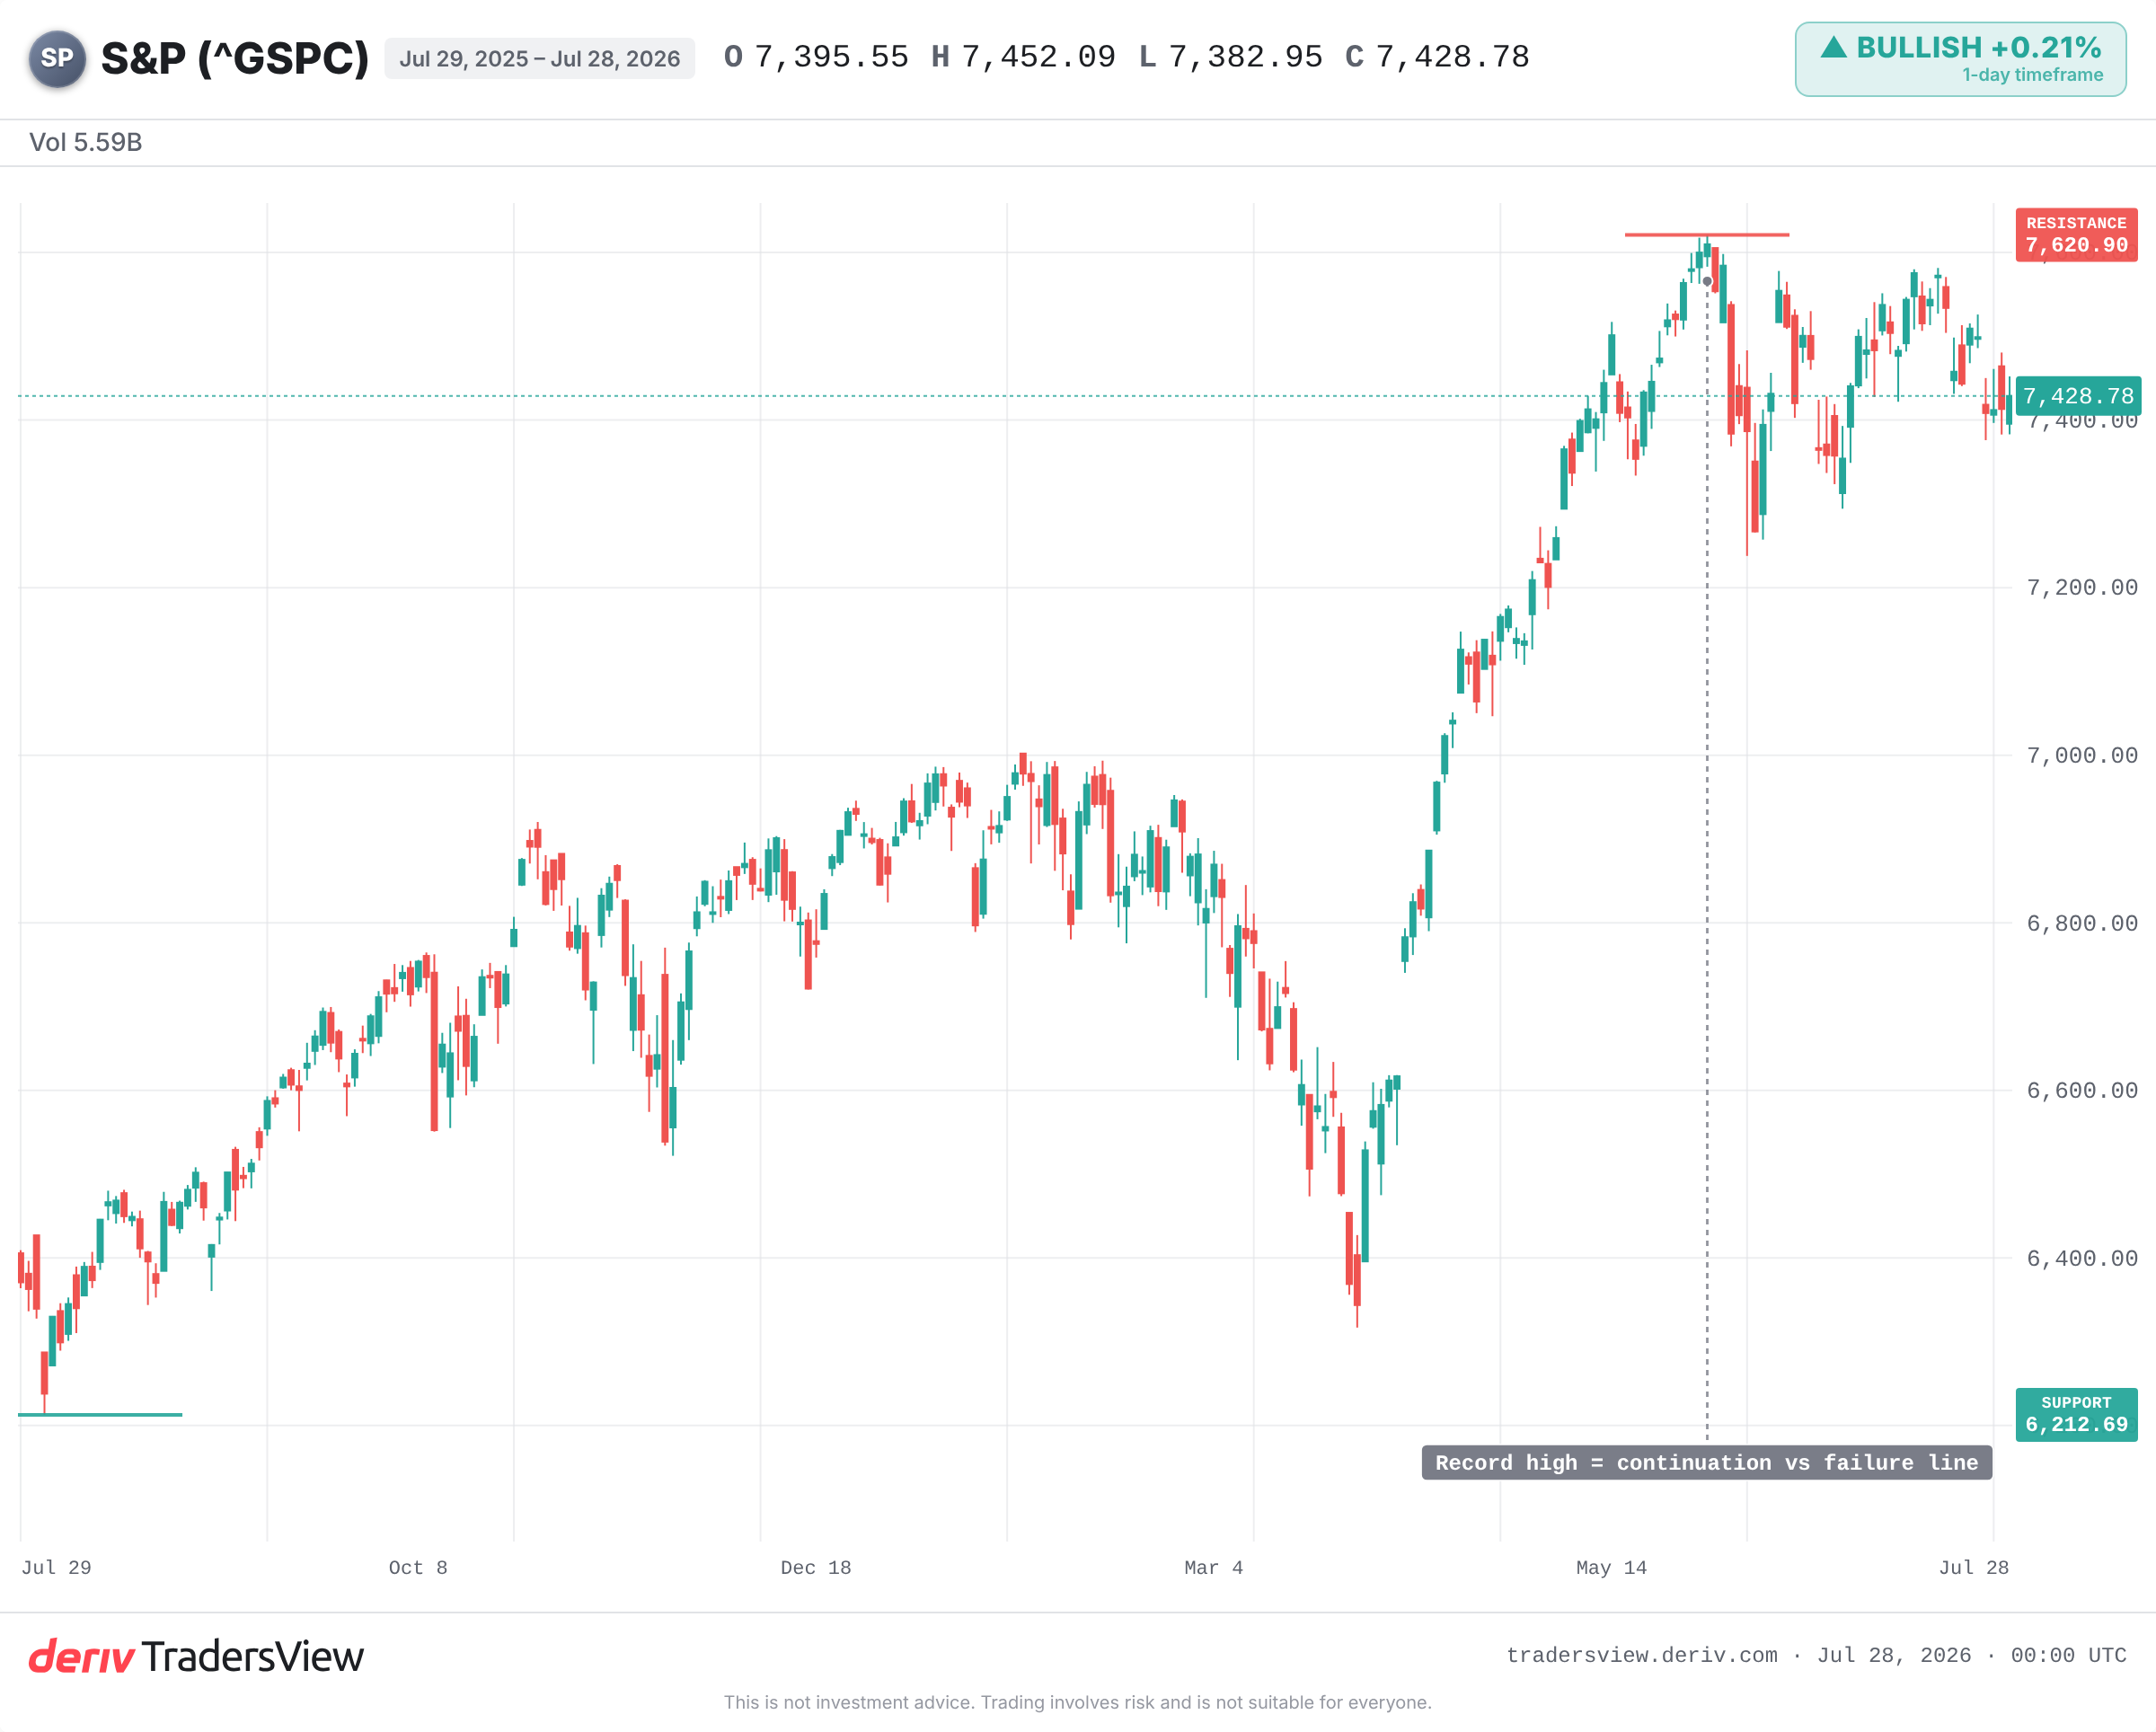
But gravity can be defied for a long time. A stronger force can hold the market up: fast earnings growth, momentum, or a wave of new capital. Right now, that stronger force is earnings.
Guidance momentum for S&P 500 companies is reportedly at its highest since at least 2011. Firms are not just expensive. They are earning at their fastest clip in over a decade. That is why the price keeps climbing even as the valuation looks stretched.
What history says about buying at the top of the range
The record is clear on the years, not the months. When the CAPE has run this high, multi-year forward returns have usually been weak.
- 1999: the CAPE peaked near its all-time high. The S&P 500 topped in 2000 and fell roughly 45% into 2002. Buy-and-hold investors waited years to get back to even.
- 1929: an extreme reading for its era gave way to a crash of more than 80%. Price did not recover for about 25 years.
- 1966: a rich valuation without a bubble story. Then a long, flat stretch through the 1970s, with inflation eating the gains.
- 2021: the CAPE climbed back above 38 in the post-COVID surge. A sharp drawdown of about 25% followed in 2022 as rates rose.
The pattern is not that expensive markets crash on schedule. It is that a high entry price lowers the odds of strong returns over the next several years, and raises the damage when the growth story wobbles.
Why valuation is useless for timing the next few months
Over any 12-month window, the CAPE tells you almost nothing. It has been a poor timing tool for over a decade. Markets have stayed near record valuations while earnings grew.
There is a patient case too. Crestmont Research found that every rolling 20-year period for the S&P 500 has ended positive. Stretch your horizon far enough and the entry price matters less.
The bears are only proven right if earnings actually roll over or rates spike. If AI-driven productivity keeps lifting margins, today's multiple can be grown into rather than snap back violently.
What to watch from here
The single biggest support under this valuation is earnings guidance. Watch whether that momentum holds or fades. Watch the record high as the line between continuation and a slide back towards the year's lows. And watch bond yields, because a higher discount rate makes expensive future earnings worth less today.
Expensive is not the same as overdue. The market can keep rising. But the price you pay sets the odds, and right now those odds are being paid for with the strongest earnings backdrop in years. If that backdrop cracks, gravity gets its say.
Frequently asked questions
The Shiller CAPE (cyclically adjusted price-to-earnings) ratio compares a market's price to its average inflation-adjusted earnings over the past ten years. Smoothing earnings over a decade strips out short-term boom-and-bust swings, giving a steadier read on how expensive stocks are.
No. A high CAPE has historically preceded weaker multi-year returns, but it does not predict when a fall happens. Markets can stay expensive for years while earnings grow, so it works as a long-run gravity signal, not a short-term timing tool.
Yes. If earnings rise fast enough, profits can catch up to the price and bring the valuation down without a large drop in the index. That depends on growth and margins holding up, which is why earnings guidance is the key thing to monitor.
Higher interest rates raise the discount rate applied to future earnings, which lowers what those earnings are worth today. Expensive, high-growth stocks are most sensitive, so a spike in bond yields tends to hit rich valuations hardest.