
Second-priciest market in 130 years and what that meant
The S&P 500 sits near a record, yet its Shiller CAPE ratio is the second-highest in 130 years. What buying at these valuations has meant before.
By the Deriv desk · 15 July 2026 · 4 min read

A high price tells you what you pay. Valuation tells you what you get. The S&P 500 sits near its record, yet by the Shiller CAPE ratio it is the second-most expensive it has been in over 130 years, beaten only by the December 1999 dot-com peak.
That single fact pulls in two directions. The index is strong. The starting point for future returns is poor. Both are true at once, and the gap between them is the whole story.
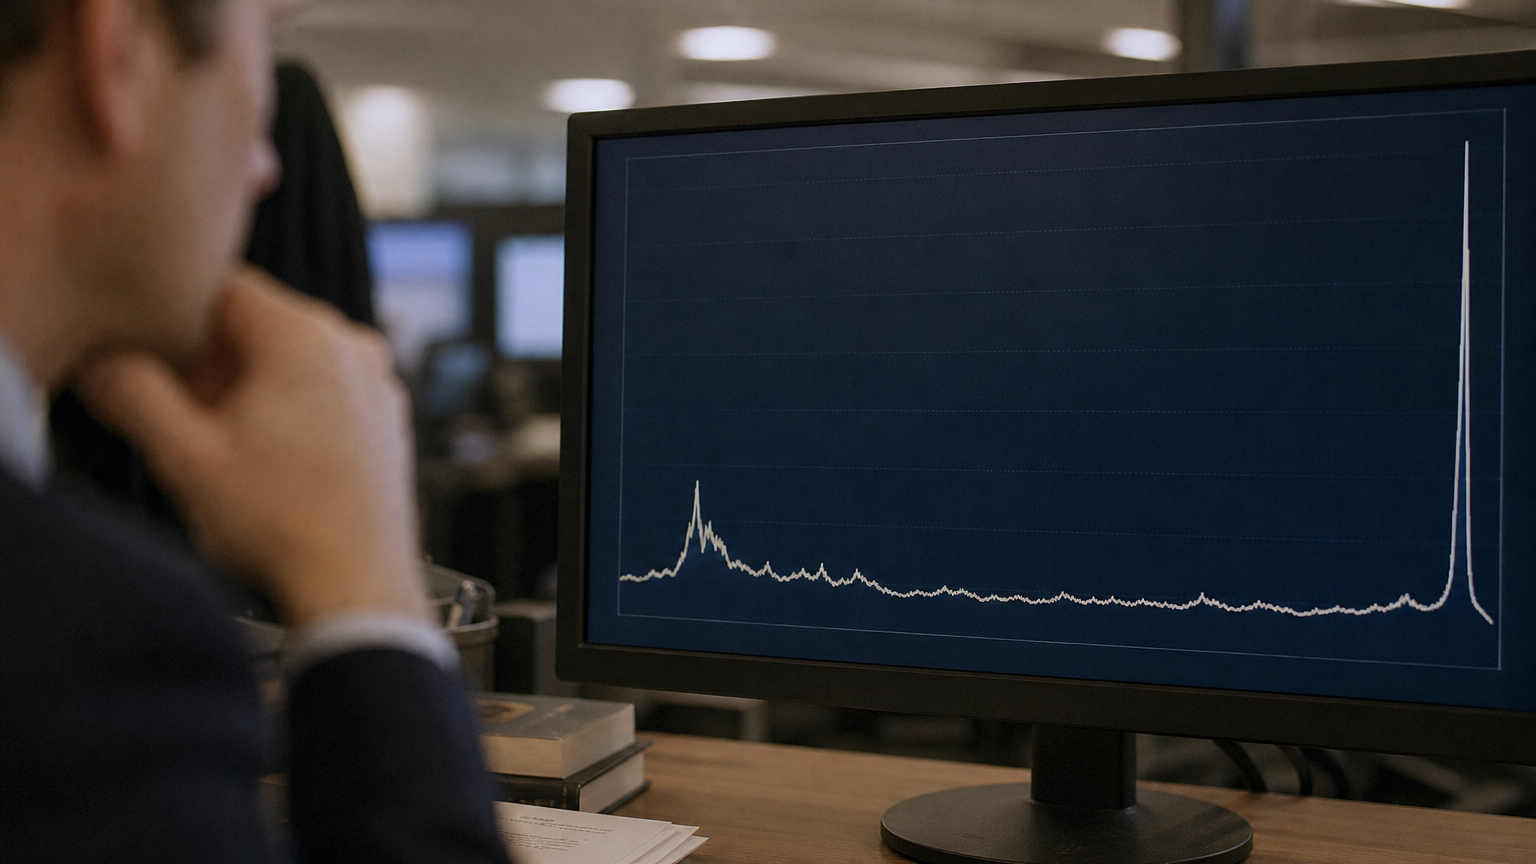
Price near a record, value near an extreme
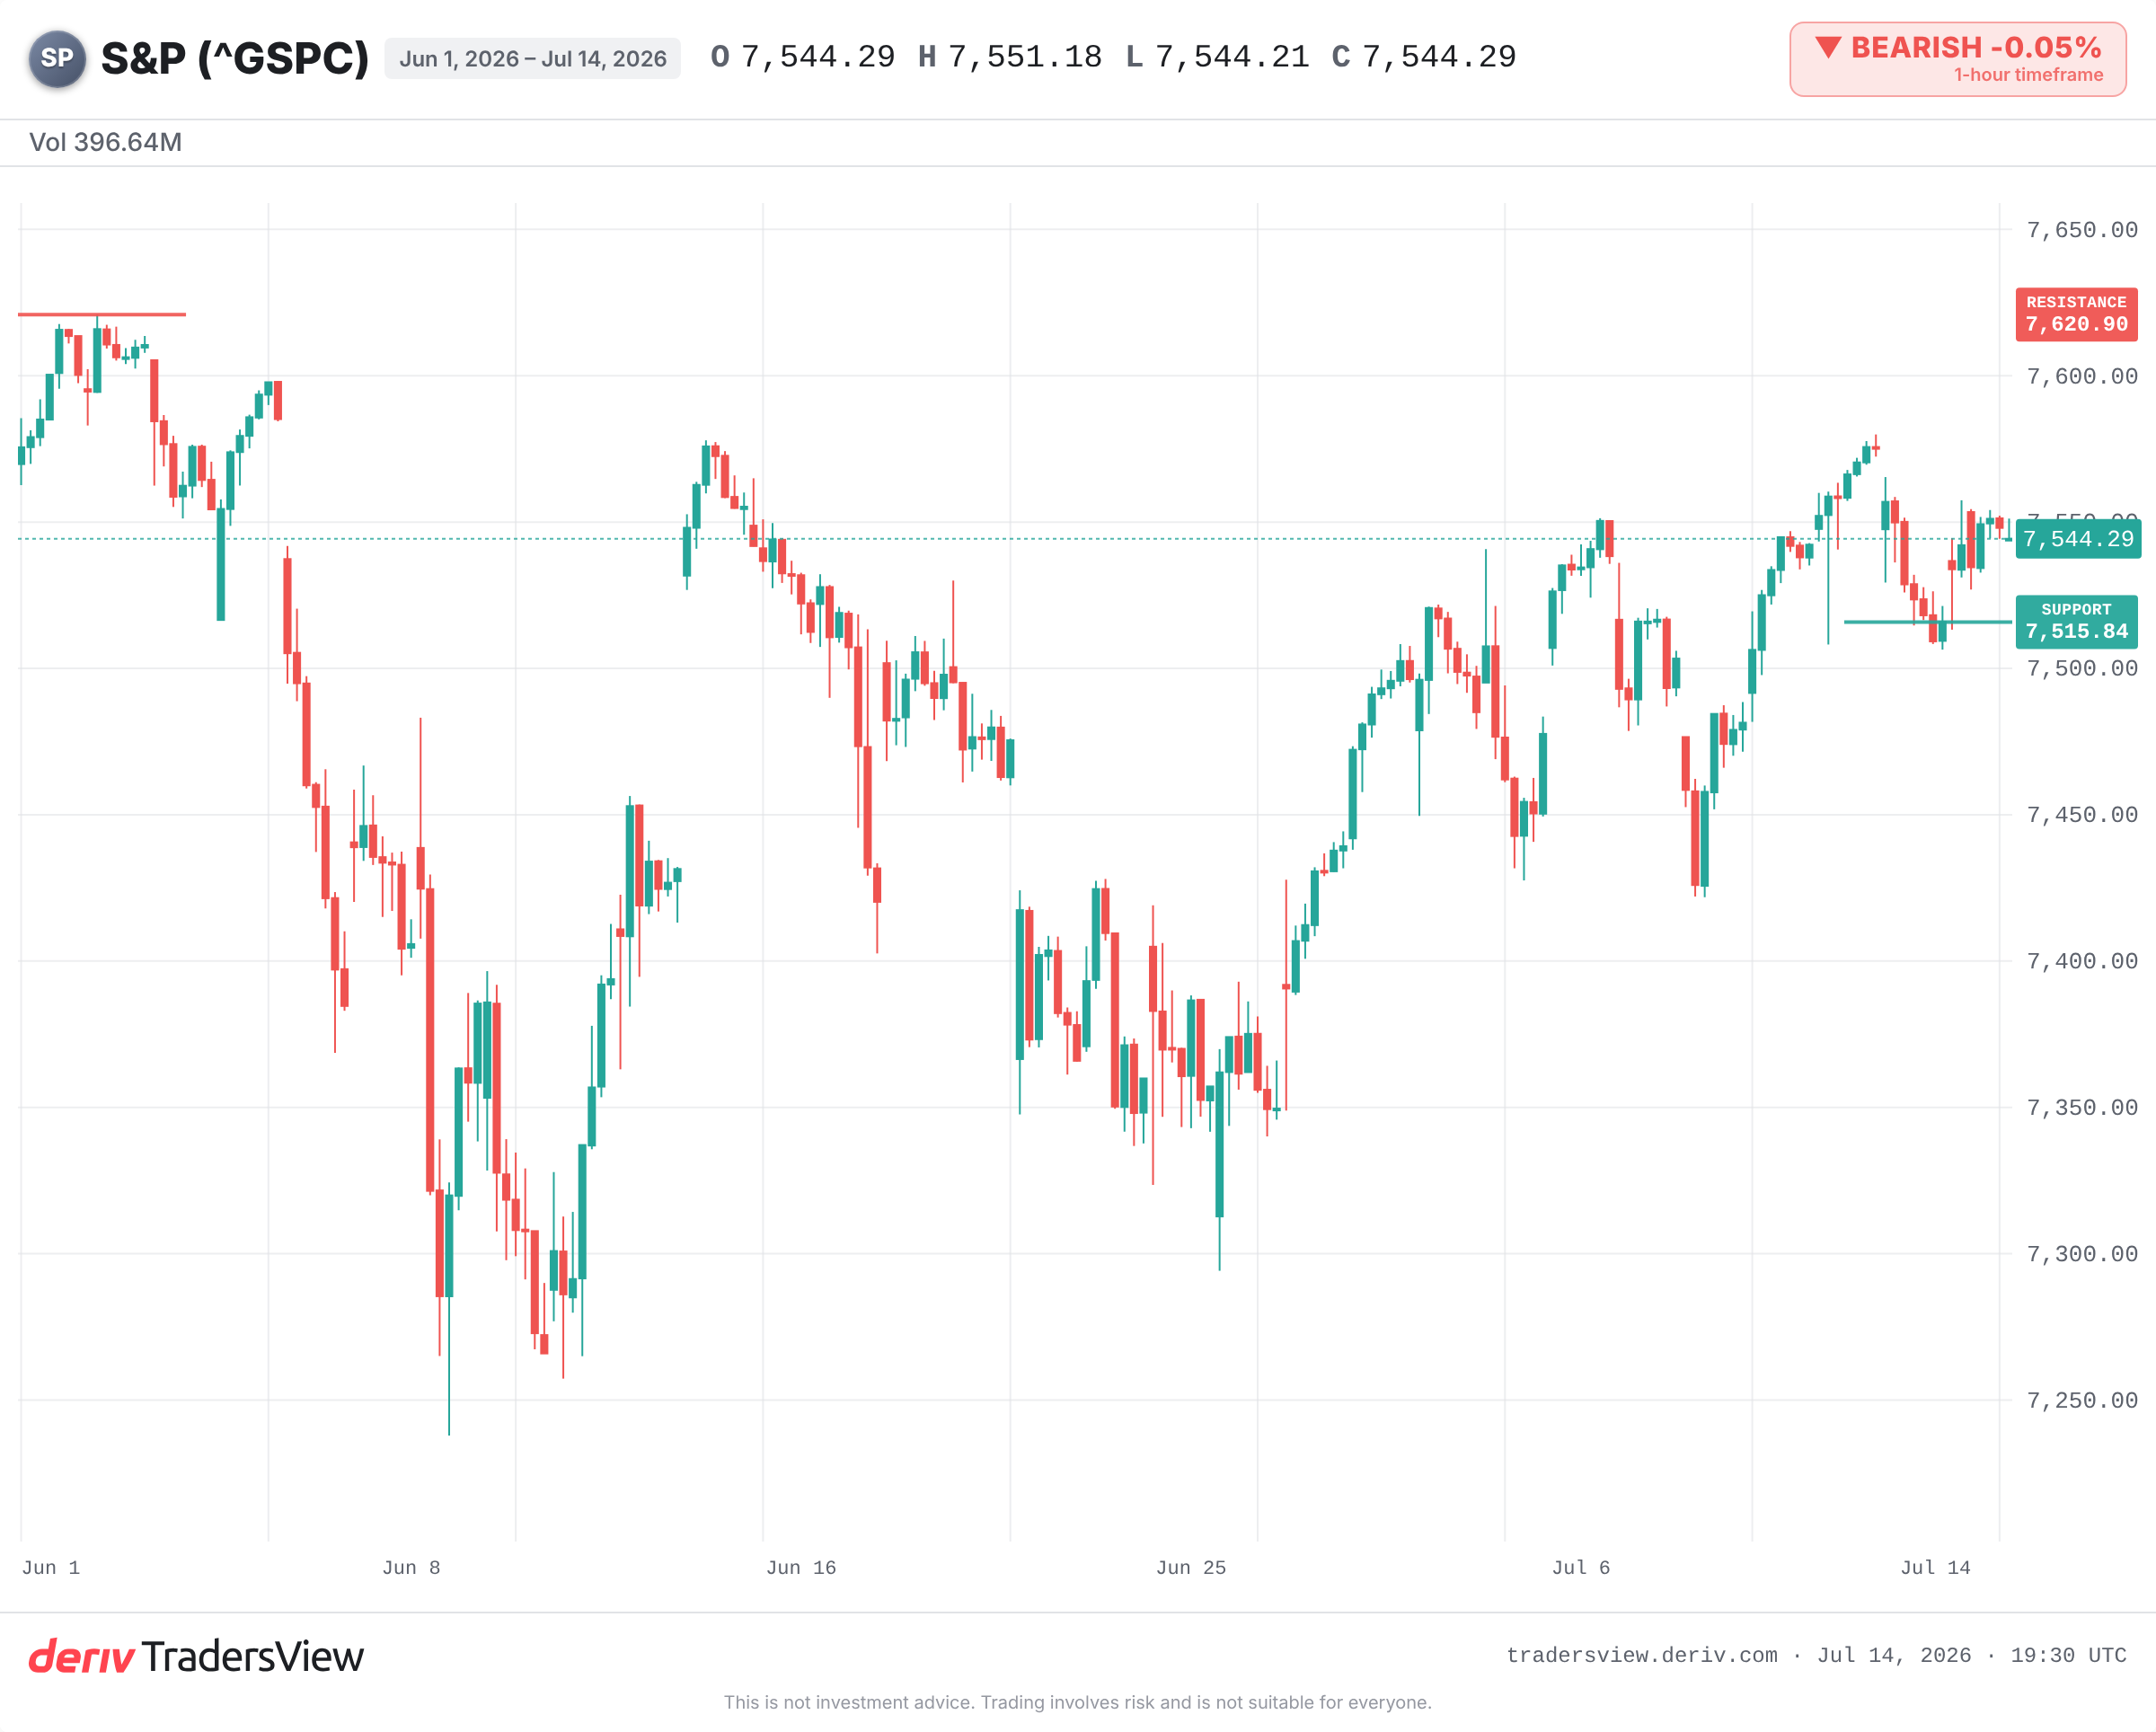
As of 14 July 2026, the S&P 500 trades in the mid-7,500s, just short of its 2026 high. Momentum looks intact.
The Shiller CAPE ratio tells a different story. It reads near 41.4, per coverage this month. In more than 130 years of data, only one reading beat it: 44.19 in December 1999. That is the rarity worth pausing on. Not "expensive", but expensive on a scale seen once before in a century.
A record price and a historic valuation extreme are not the same claim, and they rarely arrive together. Right now they have.
What CAPE actually measures
CAPE compares today's price with a decade of inflation-adjusted earnings. It smooths out good and bad years to show what you pay for a steady stream of profit.
Think of it as a rent-to-income check on the whole market. A high number does not mean prices fall tomorrow. It means you are paying more for each dollar of earnings, so more of the good news is already in the price.
What buying at this level meant last time
The 1999 comparison is the sharpest one. After CAPE peaked, the S&P 500 topped in 2000 and then fell roughly 49% into its October 2002 low. The tech-heavy Nasdaq lost about 78%. It took the S&P 500 years to reclaim the old high.
Other extremes rhyme. CAPE near 32 in September 1929 came before the Great Depression crash. Readings above 33 in early 2018 and near 38 in late 2021 preceded a volatility spike and the 2022 bear market of roughly 25%.
The pattern is not that a high CAPE calls the top. It is that starting from a high CAPE has meant thinner long-run returns and a deeper fall when the mood finally turns.
Why expensive does not mean sell
The honest other side is this. CAPE has flashed "expensive" for most of the last decade while the market kept climbing. As a timing tool, it has been useless.
Bulls argue today's index is different in kind. It leans on capital-light, high-margin technology and AI leaders, not the industrial firms CAPE was built to measure. Buybacks and the accounting of intangibles also lift the ratio versus history. On this read, fast earnings growth could let the market grow into its valuation without a price correction.
That case is real. It is also a bet that earnings keep compounding fast enough, from a very high starting multiple, with little room for a miss.
What to watch from here
The near term comes down to a few clear markers.
- A clean break to a new high versus a rejection that leaves the index stuck in the mid-7,500s.
- The 13 July dip low around 7,515.84 as support; a decisive break below hints sentiment is turning.
- Whether the mega-cap AI and chip leaders keep beating earnings or start to miss.
- The 10-year yield, which pressures high-multiple stocks directly when it rises.
The evidence leans one way. Valuation at this level is not a sell signal, but it is a smaller cushion. When the starting price is high, the market needs everything to go right, and there is less room for error if it does not.
Frequently asked questions
It was popularised by economist Robert Shiller, which is why it is often called the Shiller CAPE. It averages a decade of inflation-adjusted earnings to smooth out short-term profit swings and give a steadier read on valuation.
Not on its own. CAPE has stayed elevated for years while markets rose, so it is a poor timing tool. It speaks to long-run expected returns and downside risk, not to what happens next week or next month.
It is measured the same way, but critics argue it may overstate expensiveness for capital-light, high-margin technology firms. Accounting changes such as buybacks and intangible assets can also lift the reading versus older, industrial-era markets.
Common ones include the forward price-to-earnings ratio, price-to-sales, and comparisons of the earnings yield against the 10-year Treasury yield. No single measure is decisive; investors usually read several together.