
Extreme outflows, extreme fear and a Bitcoin bounce
Bitcoin's record June ETF outflow came at the low, not before it. Why extreme flow and fear readings describe the past and often work as contrarian signals.
By the Deriv desk · 6 July 2026 · 3 min read

A giant outflow number describes what the crowd has already done, not what happens next. Bitcoin's ETF withdrawals hit a record in June 2026, roughly $4.5 billion for the month. That figure landed at the moment of peak fear, near a 21-month low. And yet the price did not fall further from there. It bounced.
Why the worst outflow month came with the low, not before it
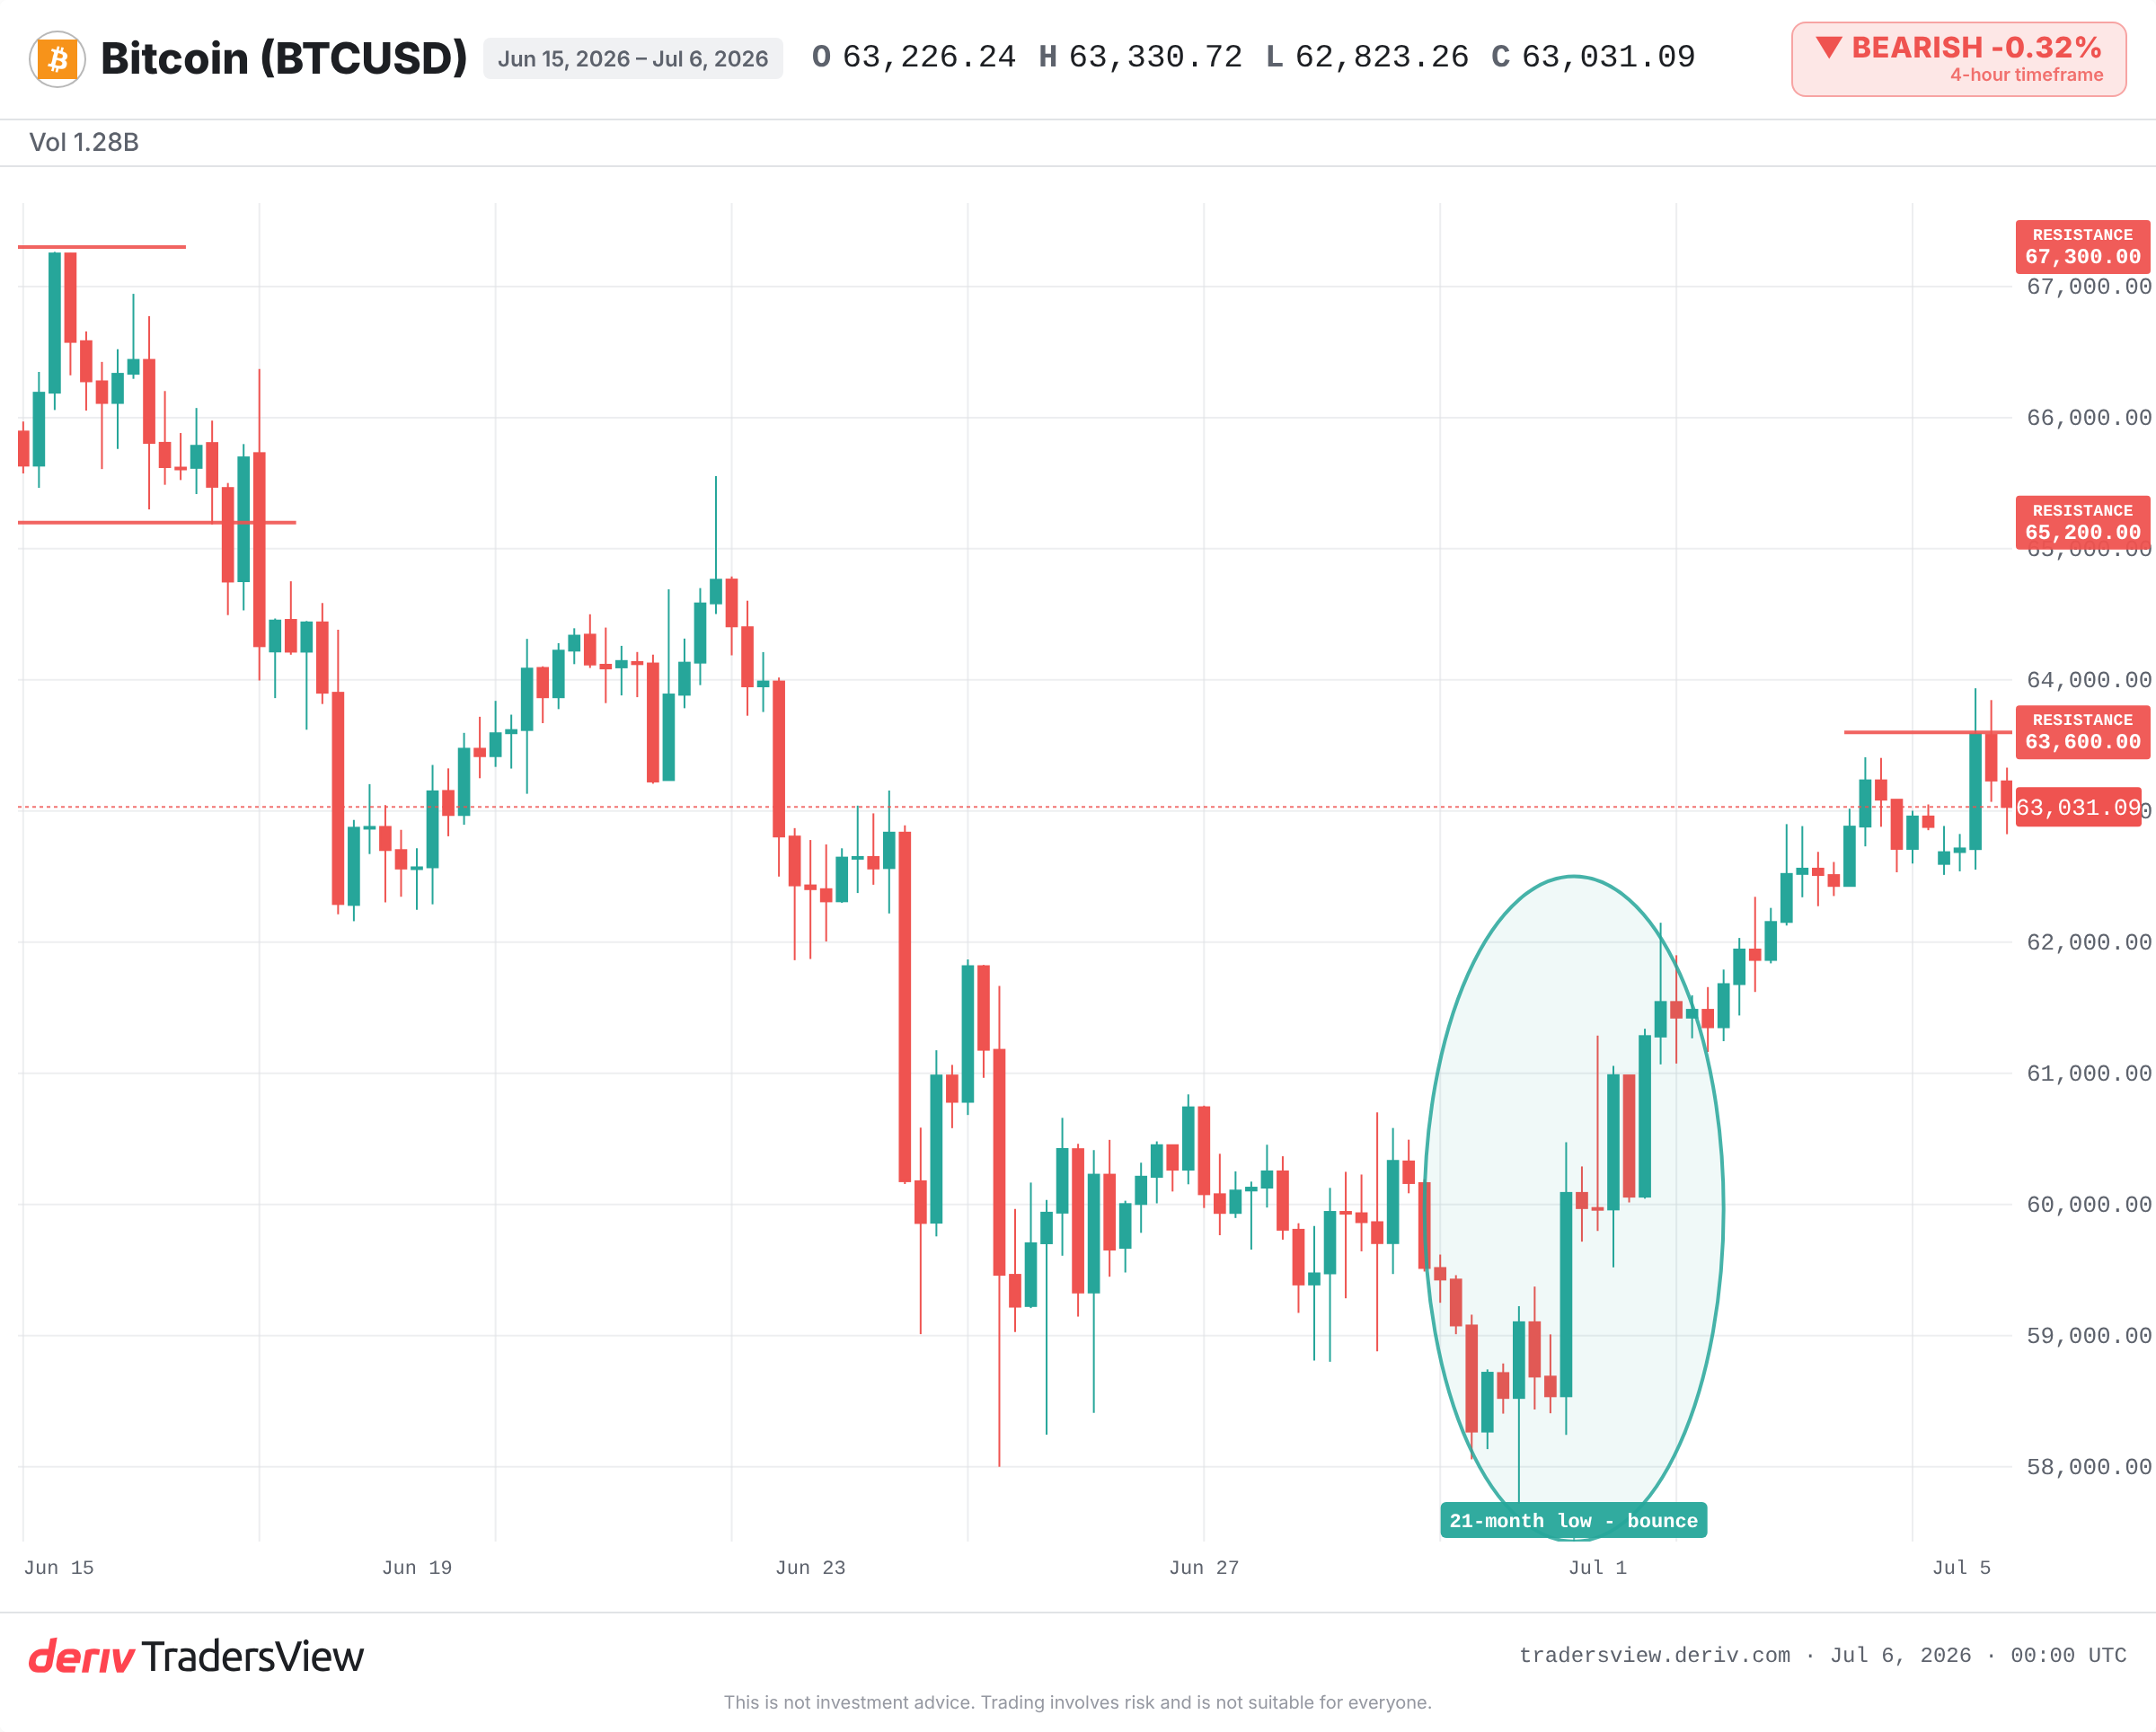
The record withdrawal coincided with a Bitcoin low near $57,800 on July 1, its weakest in 21 months. The Crypto Fear and Greed Index sat at 11 out of 100, deep in extreme fear. Every ingredient of a headline read like a reason to sell.
Then Bitcoin recovered above $62,000, and inflows returned after ten straight days of outflows. The extreme number marked the exhaustion of selling, not the start of it. By the time a flow figure is large enough to make the news, most of the selling that produced it has already happened.
How a large flow number actually reads
Flows are a record of the past. A monthly outflow total sums decisions already made and executed. It tells you the crowd got fearful. It does not tell you the next buyer's intent.
This is why extreme flow and sentiment readings often work as contrarian signals rather than confirmation. When selling reaches a record, the pool of people still wanting to sell is smaller, not larger. That is the setup for a squeeze.
Over the weekend, more than $450 million in crypto short positions were liquidated. Traders betting on further falls were forced to buy back, adding fuel to the bounce.
Does extreme fear mark a bottom? What the record shows
Past washouts rhyme with this one. In November 2022, the FTX collapse drove Fear and Greed to single digits and forced mass liquidations. Bitcoin bottomed within weeks near $15,500 and began a long recovery through 2023.
In March 2020, Bitcoin fell about 50% in a day amid a global scramble for cash. The panic low held, and a large rally followed once liquidity eased. August 2024 told the same story on a smaller scale: heavy ETF outflows, collapsing sentiment, then a local bottom and returning inflows.
The pattern is consistent: peak fear tends to be a coincident reading, not a forecast. It describes the moment, not the month ahead.
Why this bounce might still be a trap
A relief rally is not a reversal. Bitcoin remains down roughly 53% from its October 2025 high of $126,210, and it started 2026 above $93,000. The trend is still down.
Citigroup cut its 12-month Bitcoin target to $82,000 from $112,000. A short squeeze and a shift in interest-rate expectations can lift price without confirming a turn. The June US jobs print came in weak, at 57,000 against expectations near 110,000, and the futures market leaned heavily towards no change at the July Fed meeting, with Polymarket pricing an 89.5% chance of a hold.
The bull case only gains weight if inflows persist for weeks and Bitcoin reclaims resistance at $63,600, $65,200 and $67,300. A slide back below the $57,800 low would undo the argument. The evidence leans towards treating extreme readings as a reason to slow down, not a reason to sell in a panic.
What to watch next
- Whether ETF inflows continue for weeks or flip back to outflows.
- The resistance band at $63,600, $65,200 and $67,300; failure to reclaim it keeps the downtrend intact.
- A break below the July 1 low near $57,800, which would invalidate the bounce.
- The July Fed tone against the market's near-certain no-change pricing.
Frequently asked questions
It is a sentiment gauge scored from 0 to 100, where low readings signal extreme fear and high readings signal greed. It blends factors like volatility, momentum and volume. Single-digit readings have historically clustered near local price bottoms rather than tops.
Flows record decisions already made, so they describe the recent past more than the future. Large one-off outflow figures often coincide with fear peaks. Sustained inflows over several weeks carry more weight as a trend signal than a single headline number.
A short squeeze happens when traders betting on lower prices are forced to buy back their positions as price rises. That forced buying pushes price up further. Over $450 million in crypto shorts were liquidated over the weekend of July 5-6, 2026.
Yes, on the broader picture. Bitcoin remains down roughly 53% from its October 2025 high and started 2026 above $93,000. A relief rally can lift price without reversing the trend until key resistance levels are reclaimed and held.