
Is Tesla's cash burn a bridge to profit or a trap?
A company that spends more cash than it earns is not automatically in trouble. Sometimes it is investing hard for the future. The market's job is to tell
By the Deriv desk · 23 July 2026 · 4 min read

A company that spends more cash than it earns is not automatically in trouble. Sometimes it is investing hard for the future. The market's job is to tell the two apart, and Tesla is the live test case.
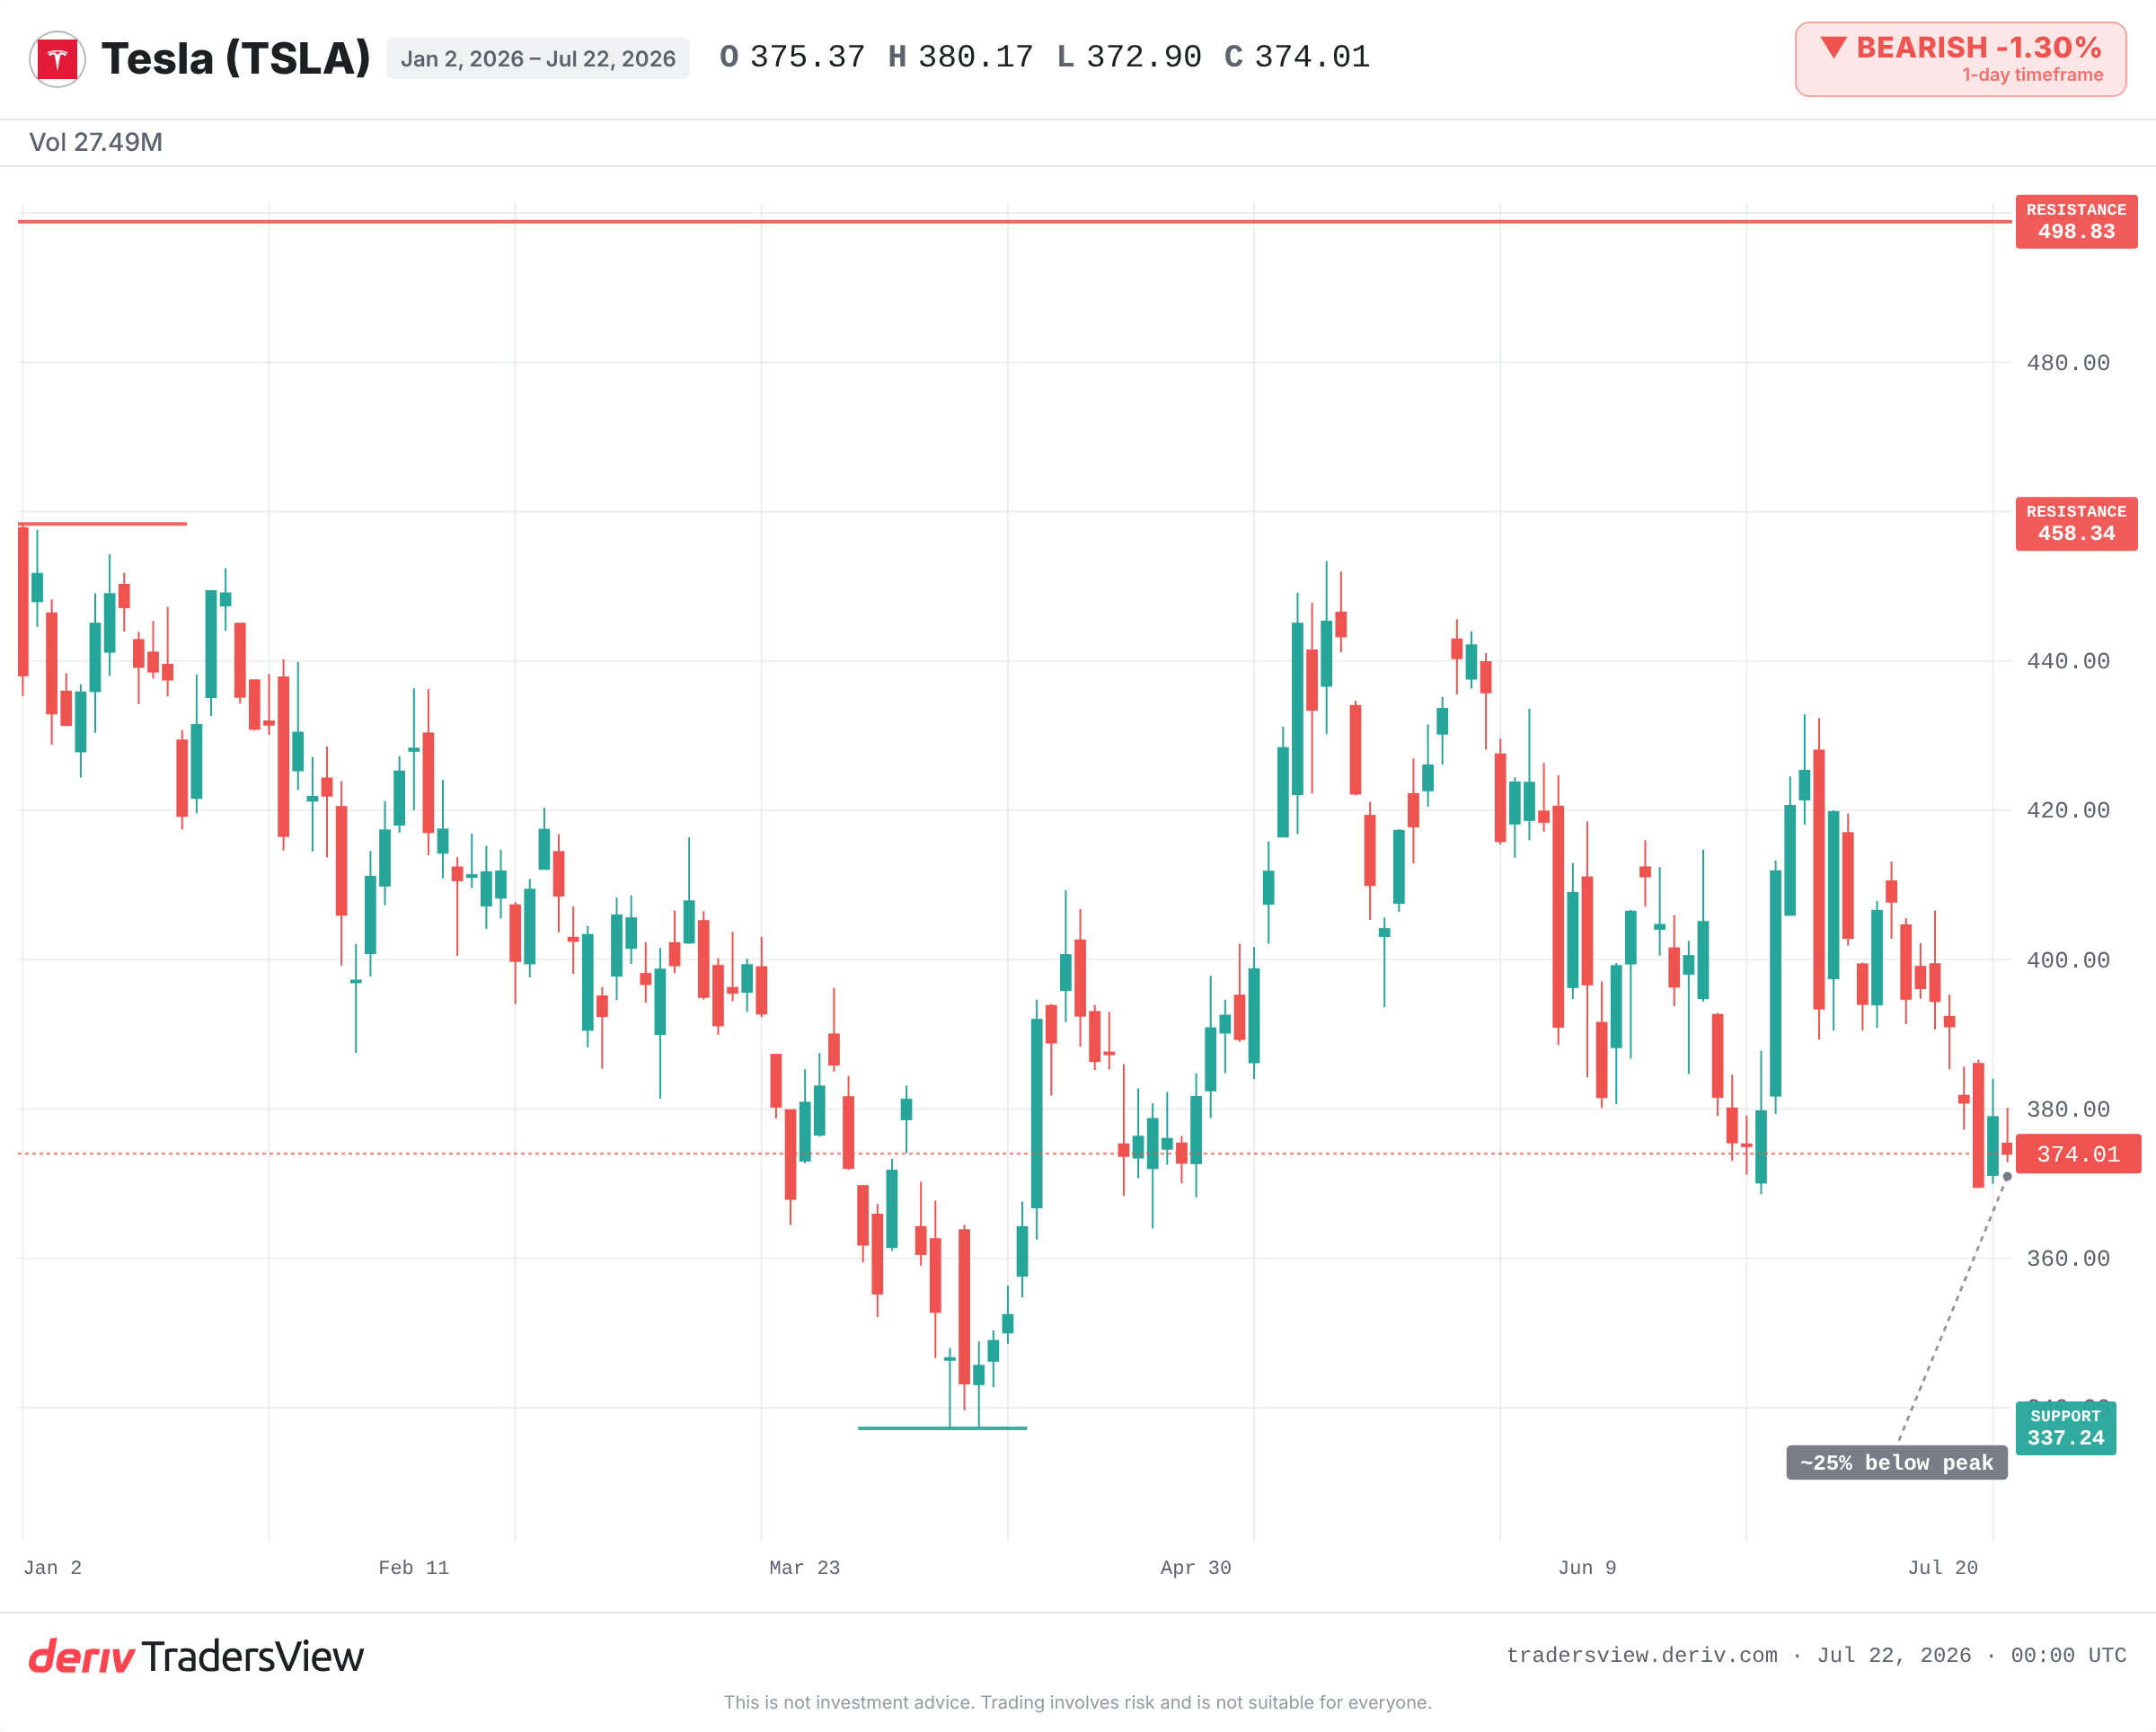
Tesla just posted its first negative free cash flow in over two years. Capital spending on AI, robotaxi and the Optimus robot surged past what the business brought in. The stock trades roughly a quarter below its 2025 peak. The question underneath the headline is simple: is this burn a bridge to future profit, or a warning?
What free cash flow actually tells you
Free cash flow is the cash left after a company pays to run and expand itself. Profit can look healthy while cash drains out the door. That gap is why free cash flow often matters more than the earnings headline.
When it flips negative, the company is spending faster than it earns. That can mean distress. It can also mean a deliberate, front-loaded bet. The number alone does not tell you which.
Why heavy spending can be an investment, not a warning
Tesla has done this before. In 2017 and 2018, it burned cash through the Model 3 ramp. Short interest was heavy and bankruptcy talk circulated. Then free cash flow turned positive and the stock ran for years.
The bull read now echoes that. Management has framed the current spend as investment in autonomy and robotics, with capex guided to ease again in 2027. The cash balance is still large and has slipped only modestly. If the robotaxi and full self-driving roadmap delivers, today's burn looks like 2018 in hindsight.
When heavy spending destroys value instead
The other side has history too. In the late-1990s telecom and dot-com boom, firms poured record capital into infrastructure ahead of demand. They were sure they were building the future. Instead they built excess capacity, earned weak returns and suffered deep drawdowns.
That is the risk with any capex surge: spending ahead of demand that never arrives. The same cash burn can be a ramp or a trap. The difference shows up later, in whether revenue and margins turn up as the spending rolls off.
How to tell the difference from here
You cannot settle this from one quarter. You watch a chain of evidence over the next few reports:
- Capex direction. Does spending keep climbing through the second half of 2026, or start easing towards the 2027 forecast?
- The cash balance. A modest decline is tolerable. A fast drawdown is not.
- Proof the bets are working. New robotaxi cities and clear FSD progress justify the spend. Silence does not.
- The core business. Auto gross margin and deliveries have to keep funding the ambition.
On the chart, the year-to-date low near 337 marks the floor traders are watching, with this year's high near 458 as the ceiling. The stock's typical daily swing is wide, so single-day moves say little about the longer question.
Where the evidence leans
The obvious read, a cash machine suddenly burning cash, is the scary one. The stronger read is that this is planned, front-loaded investment with a large cash cushion intact and capex set to ease. That leans towards investment over distress. But it is a lean, not a verdict.
The proof is in the follow-through. If margins and deliveries firm as spending rolls off and free cash flow returns to positive, the 2018 comparison holds. If capex keeps rising while the autonomy milestones slip, the dot-com comparison starts to fit. Watch the cash, not the drama.
Frequently asked questions
No. It can signal distress, but it can also reflect a deliberate, front-loaded investment in future growth. The context, especially why the cash is being spent and how much cash remains, decides which.
Profit is an accounting measure that can look healthy while cash leaves the business. Free cash flow is the actual cash left after running and expanding the company, so it can turn negative even when reported profit is positive.
Capex, or capital expenditure, is money spent on long-term assets like factories, equipment and technology. A surge in capex directly reduces free cash flow because that cash goes out before it generates returns.
Before this recent quarter, Tesla's last sustained period of negative free cash flow was around 2017 to 2018, during the Model 3 production ramp. It later turned cash-flow positive as production scaled.