
Five banks, one gold price, five different targets
JPMorgan cut its gold target while others stayed bullish above $5,000. Read the forecast spread instead of anchoring to one number.
By the Deriv desk · 7 July 2026 · 4 min read

When analysts publicly disagree about the same asset at the same price, the gap between their targets is the message. It tells you how uncertain the future is.
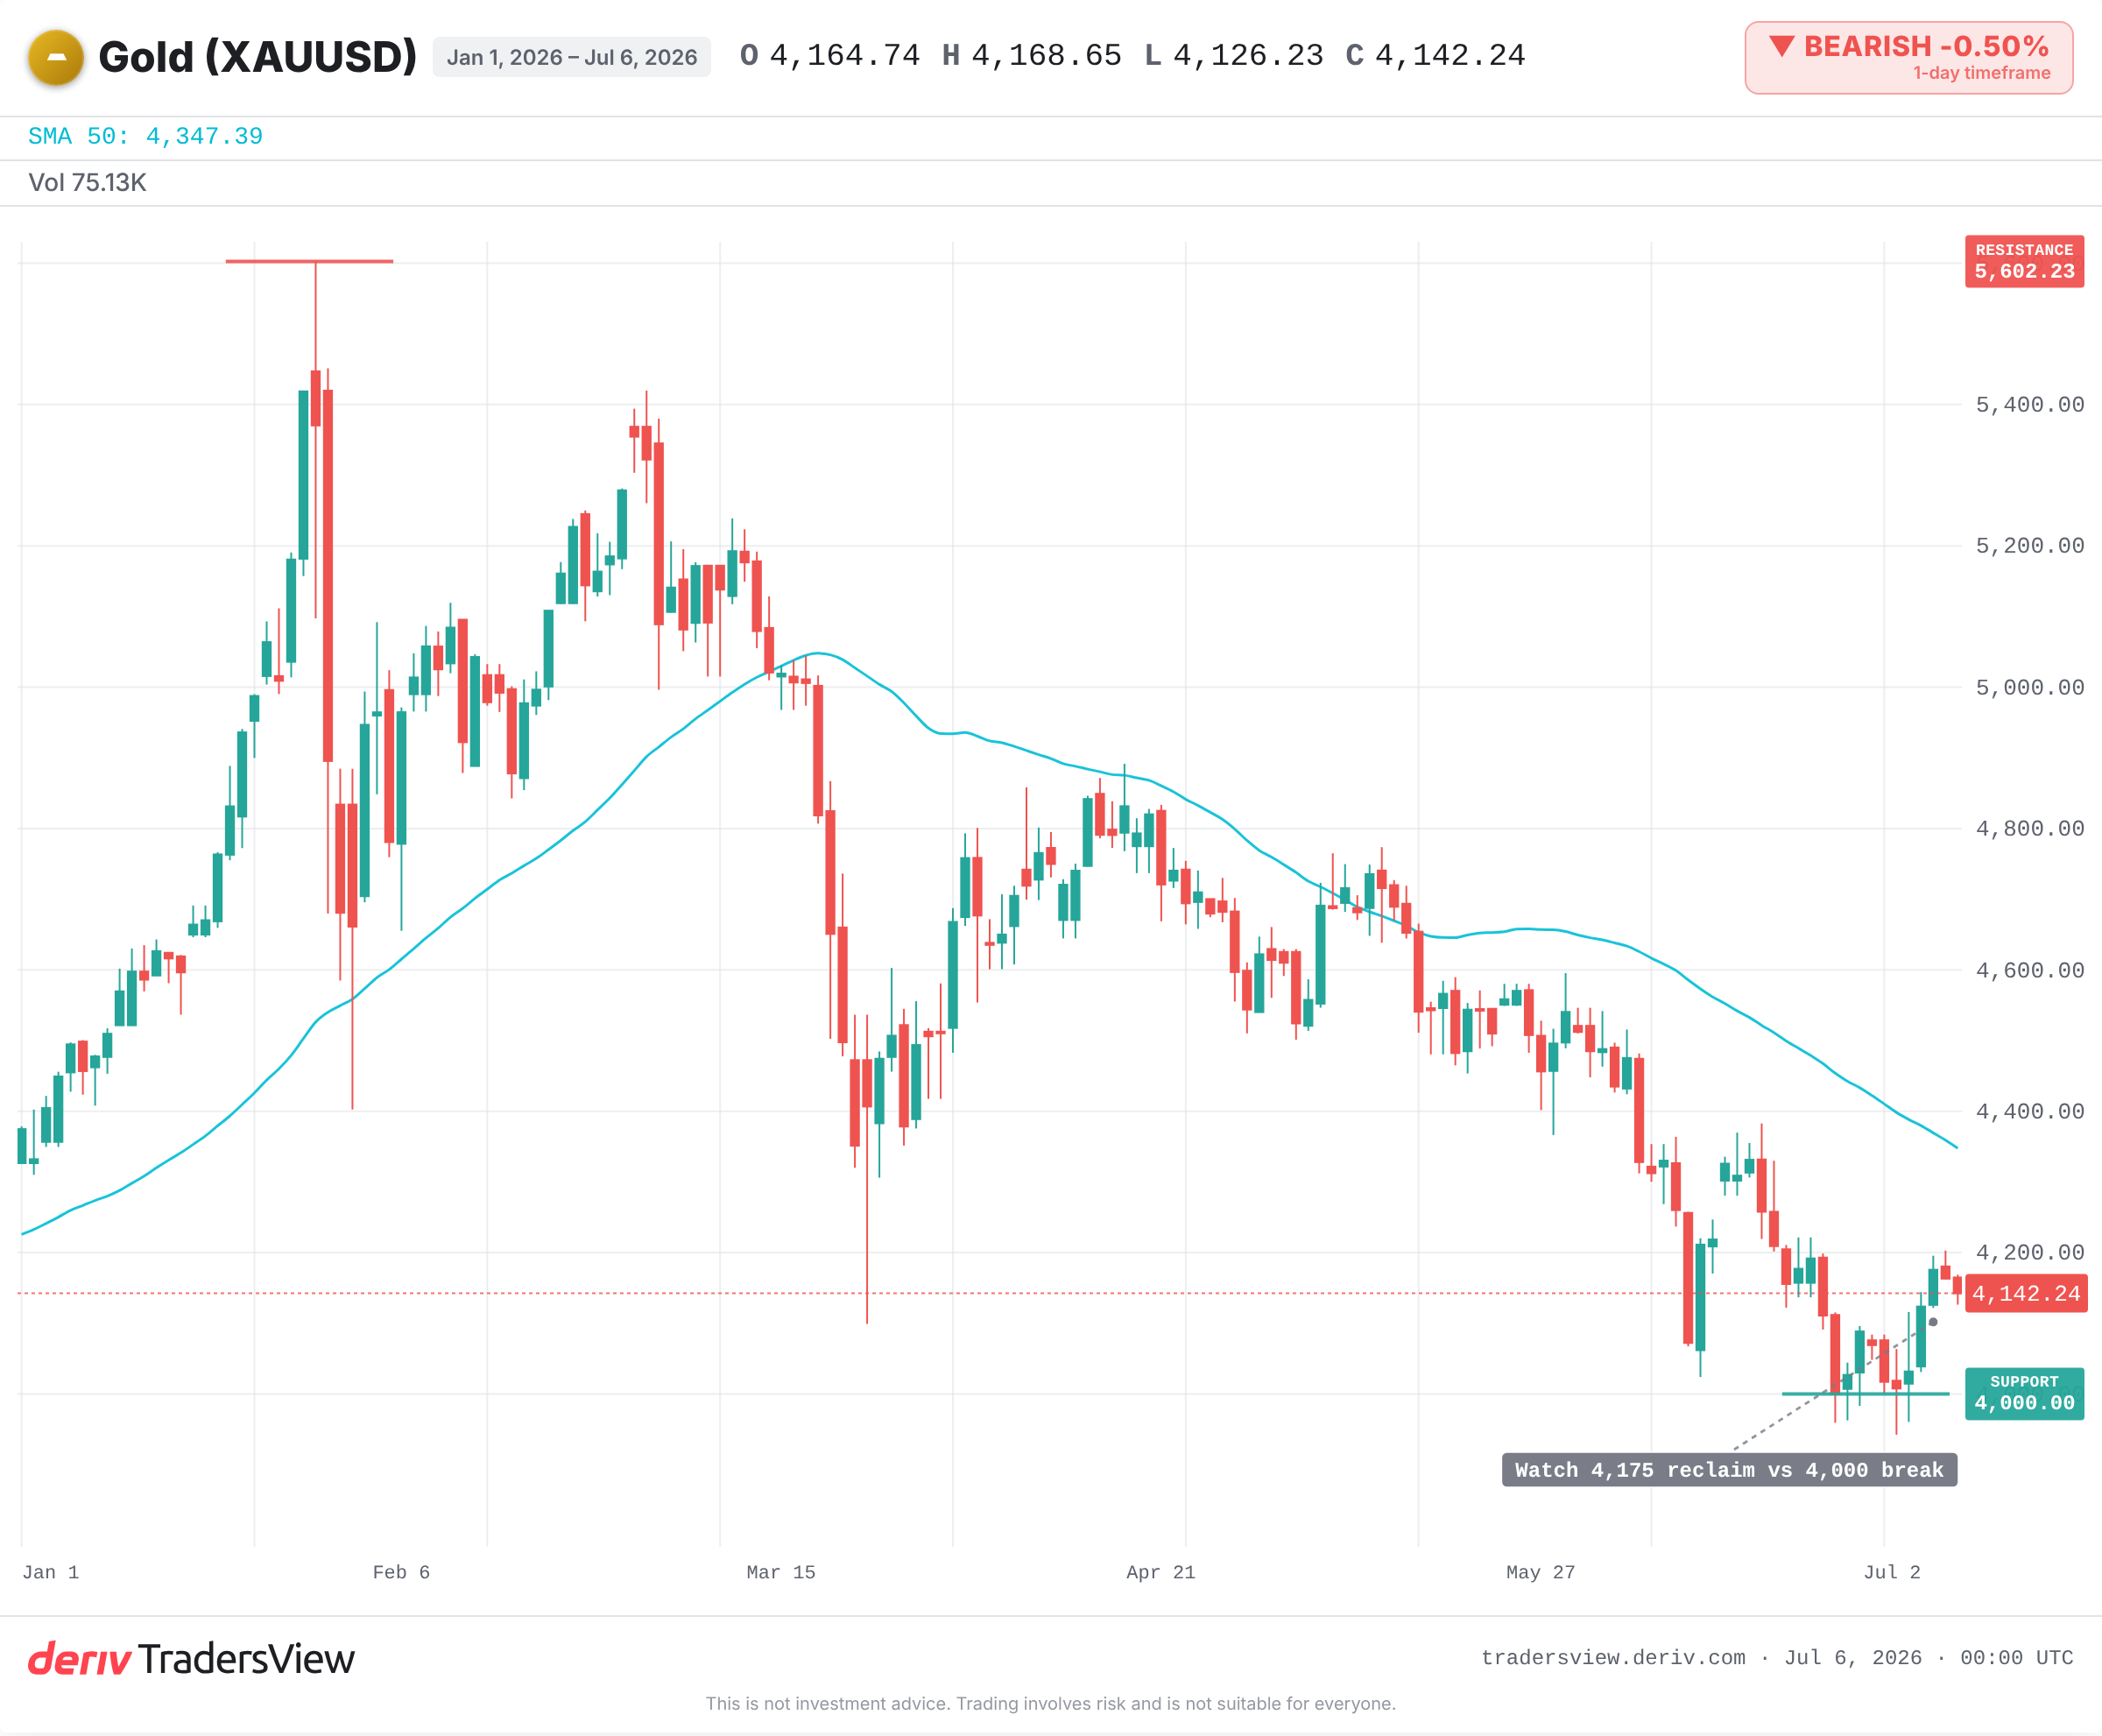
Gold is a live example right now. Spot trades around $4,140 after peaking near $5,500 in January 2026. JPMorgan just cut its Q4 target by a quarter. Other major banks left their bullish calls untouched. Same metal, same day, wildly different numbers.
Why one bank cutting its gold target is not a crash signal
The obvious read is that JPMorgan turned bearish, so gold is topping. That read is wrong on the maths.
JPMorgan's revised Q4 target still sits above today's spot price. A cut from a higher number to a lower one is not a call for a fall. It is a smaller rise than before. Confusing a trimmed forecast with a sell signal is one of the most common traps for anyone new to reading research.
A price target is a bet on assumptions, not a promise
Every target is built on inputs: real yields, physical demand, and central-bank buying. Change one input and the number moves. JPMorgan cited softer demand and higher real yields for its cut. That is the mechanism talking, not a verdict on gold itself.
So the useful question is never "what is the target?" but "what assumption changed to move it?" Work back to the why, and a forecast becomes information instead of an instruction.
What the spread between forecasts actually tells you
Look at the range on the table today. JPMorgan is the cautious voice. Goldman Sachs holds an end-2026 call well above spot. Standard Chartered, TD Securities and State Street project higher still into 2027. An OMFIF survey found most central banks expect prices between $5,000 and $6,000 by mid-2027, backed by steady official-sector buying near 60 tonnes a month.
That is a wide spread. A wide spread is not a mess to resolve. It is a map of how much the future depends on inputs nobody can pin down. The width of disagreement is a measure of uncertainty, and reading the range beats anchoring to any single number.

What history says about a wall of bullish gold targets
Divergence often comes before big moves. Gold peaked near $1,900 in September 2011 while banks held clashing targets. It then fell roughly 40% into 2015, a drop most bulls never forecast.
After the August 2020 record above $2,000, forecasters split hard. The cautious camp calling for mean reversion as real yields rose was right for over a year, even though the long-term bull case later held. In 2013, rising real-yield expectations forced cuts across banks. The same real-yield mechanism JPMorgan now cites drove that move.
The genuine case for caution
The cautious call could deepen. If central-bank buying slows from its current pace and real yields keep climbing, the $5,000-plus bulls may just be extending a trend that has already peaked.
What would prove the cautious view right: sustained ETF outflows, a firmer dollar, higher real yields, and a visible drop in official-sector purchases. Gold is also trading below its 50-day moving average, a near-term bearish tilt worth watching.
What to watch instead of one number
- Real yields, the input JPMorgan named for its downgrade.
- The US dollar, which pressures gold priced in USD.
- Central-bank buying, whether it holds near 60 tonnes a month or slows.
- Whether spot reclaims the anchor near $4,175 or breaks towards $4,000.
The lesson outlasts this week. When credible people disagree about the same price, do not pick a hero forecaster. Read why they differ, and treat the spread as the honest picture of what nobody yet knows.
Frequently asked questions
They are estimates based on assumptions about real yields, demand and central-bank buying, not predictions of fact. History shows forecasts often miss large moves, so treat them as scenarios rather than guarantees.
Real yields and the US dollar tend to dominate near term. When real yields rise or the dollar strengthens, gold priced in dollars usually comes under pressure, regardless of longer-term demand stories.
Central banks buy gold to diversify reserves away from a single currency and to hold an asset with no counterparty risk. Steady official-sector purchases have been a key support behind many bullish forecasts.
No. A price below the 50-day moving average signals a near-term bearish tilt, not a certain decline. It is one input among several, and a reclaim of the level would soften that signal.