
Gold's $4,500 vs $5,500 split: which force is winning?
Banks disagree on gold from $4,500 to $5,500. The split reveals two forces fighting for control, and shows how to read a two-sided market.
By the Deriv desk · 9 July 2026 · 3 min read

When the biggest banks disagree this loudly about gold, the disagreement is the signal. It tells you the price is caught between two opposing forces, not that one analyst has the answer. Your job is not to pick a guru. It is to watch which force is winning.
Why the banks can't agree on gold right now
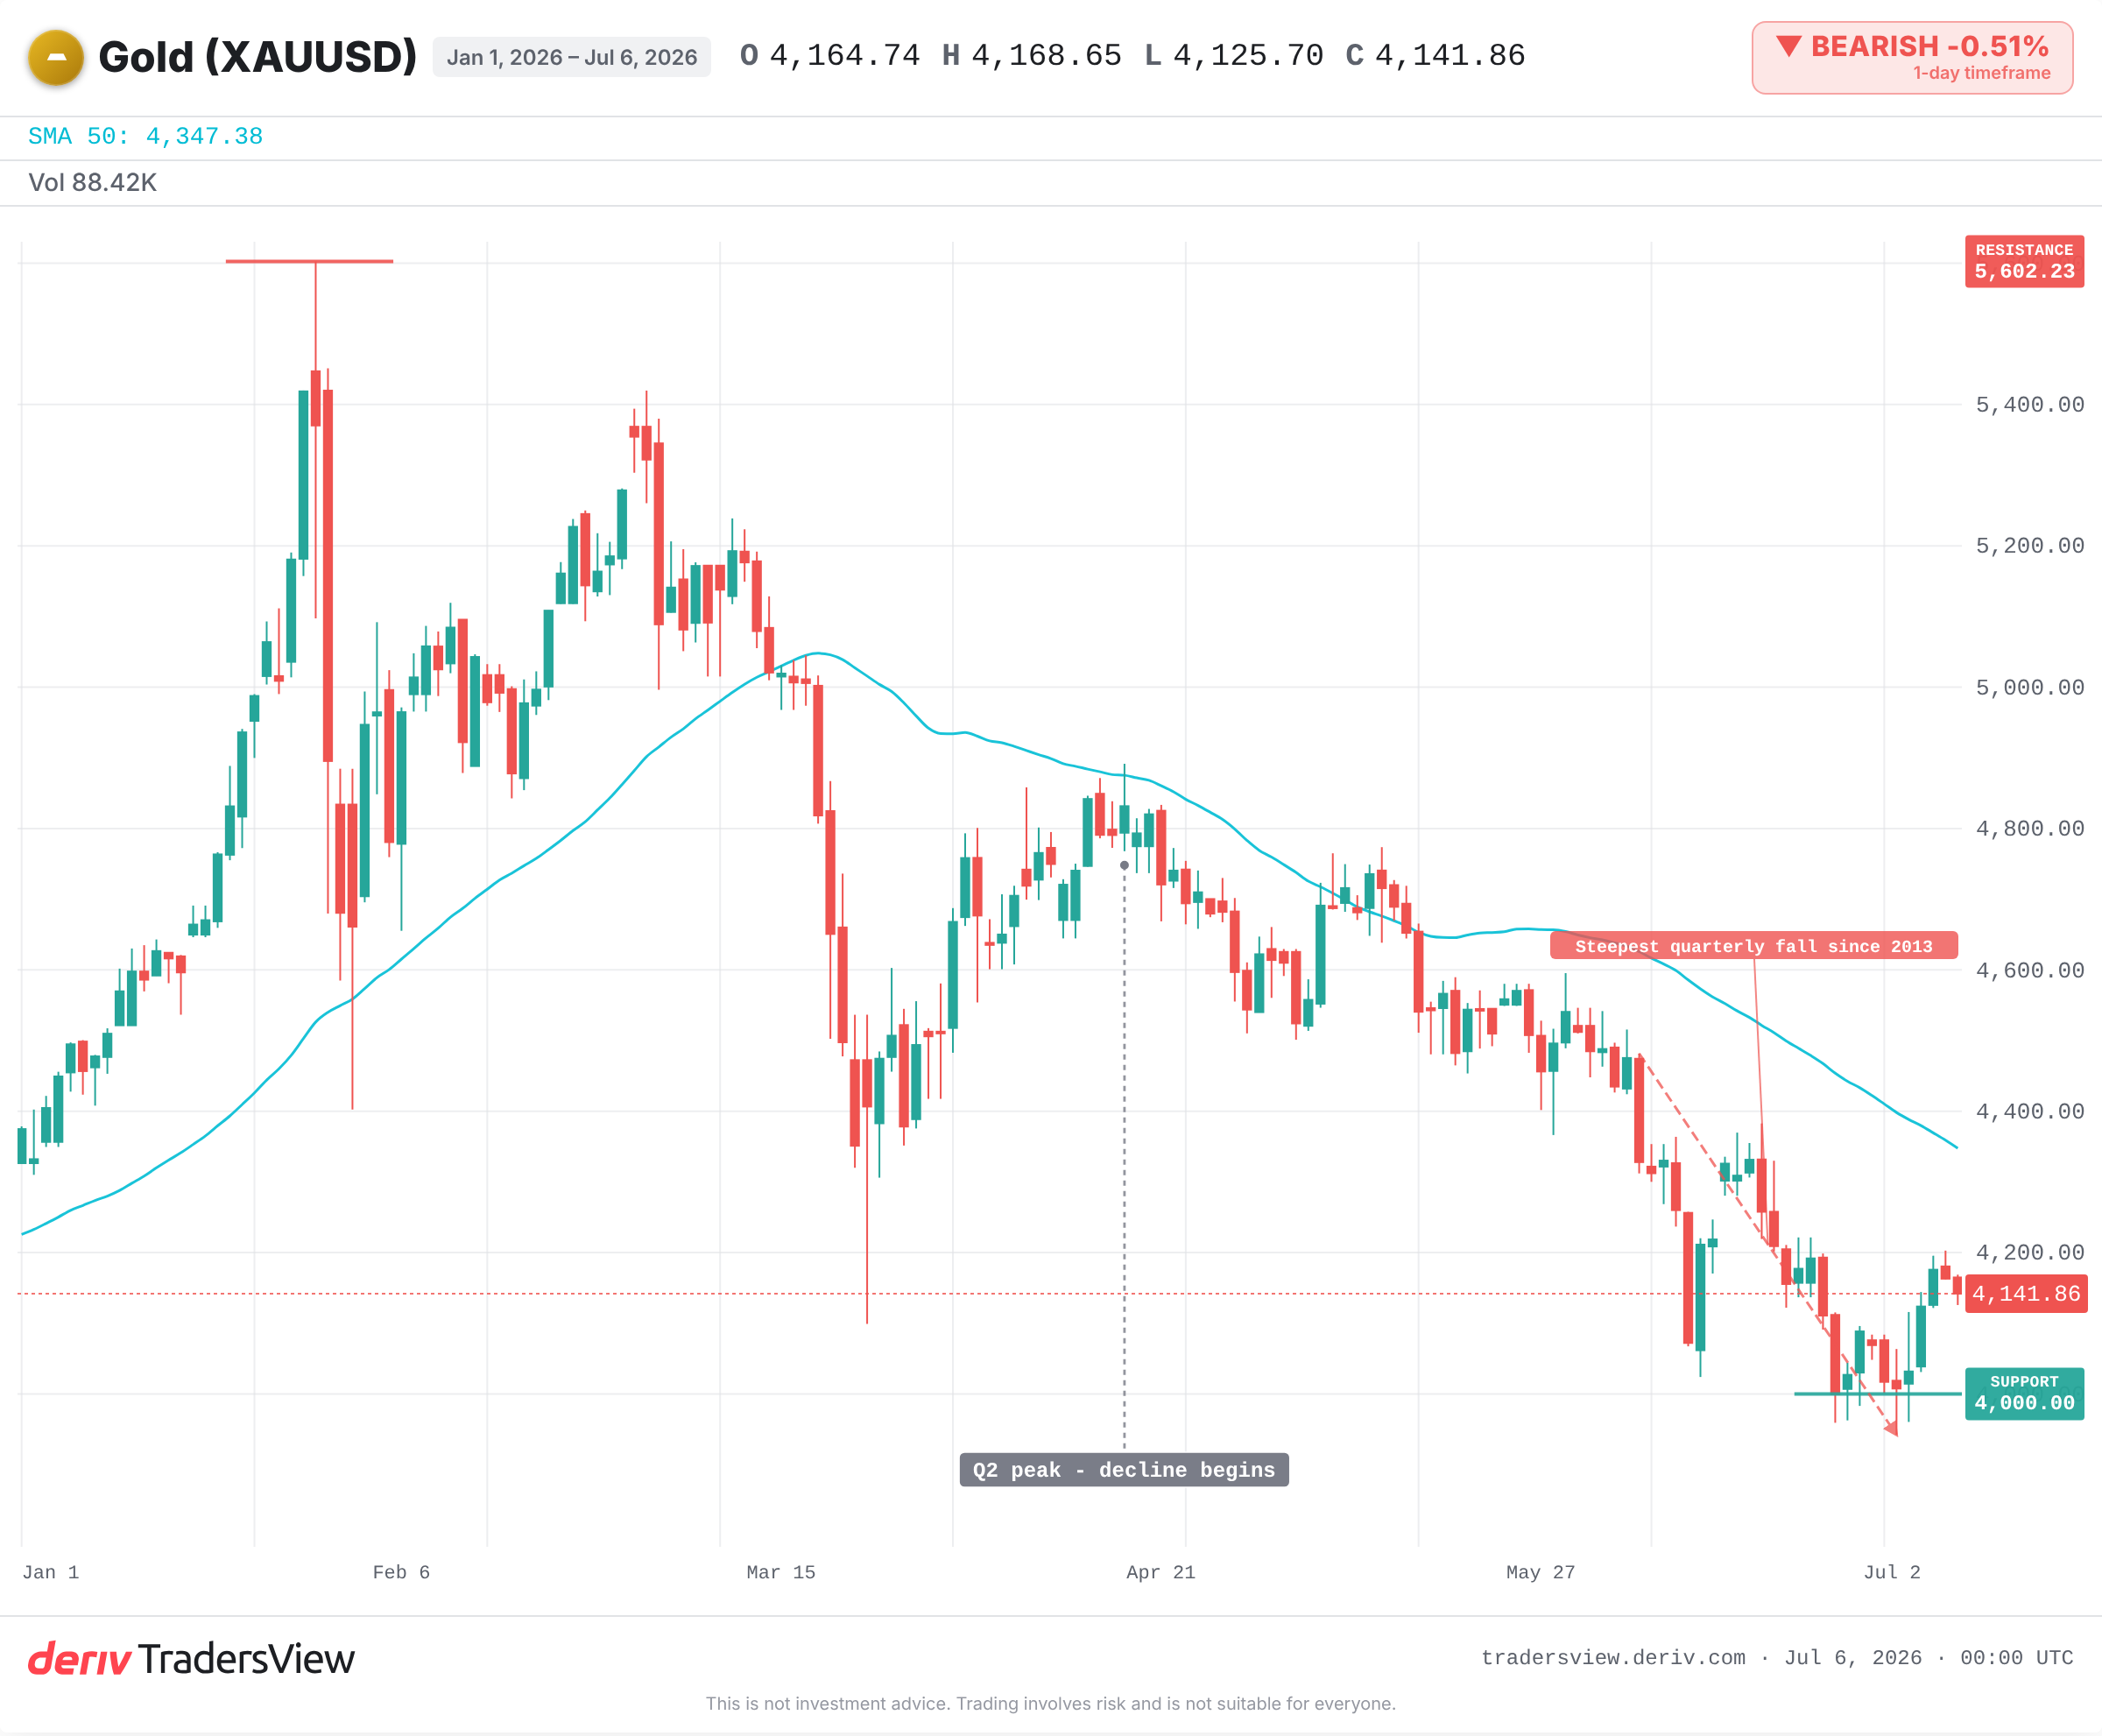
Gold trades near a multi-month low after its steepest quarterly fall since 2013. JPMorgan just cut its Q4 target by about a quarter. Goldman Sachs holds a far higher end-2026 view. State Street sees higher still.
These are not small gaps. They are three serious desks looking at the same chart and reaching wildly different conclusions. That happens for one reason. Two forces are pulling gold in opposite directions, and nobody knows yet which one breaks first.
The near-term force pulling gold down
One camp watches the short-term drivers. Rising real yields make gold, which pays no interest, less attractive to hold. Higher Fed rate-hike odds add to the pressure. And investors have been selling gold-backed funds, with heavy redemptions in June.
After weak June payrolls, the futures market leaned towards a September hike as a real possibility. Sticky inflation with soft growth muddies the Federal Reserve's path further. This is the force behind the falling price, and behind JPMorgan's cut.
The structural force holding gold up
The other camp looks past the next few months. Central banks have bought gold at a record pace since 2022, roughly 1,000 tonnes a year. That official-sector demand is a steady floor under the price.
A recent central-bank survey found most respondents expect gold materially higher within two years. This structural bid is the backbone of every bullish target on the board. It is slow, patient, and does not care about one payrolls print.
Even the bear is pointing up
The detail most headlines miss is that JPMorgan's slashed target still sits above the current price. The bear-of-the-week is forecasting upside from here.
So the real split is not bull versus bear. It is fast versus slow. The near-term force wins the day-to-day tape. The structural force argues over the longer run. Reading forecasts this way beats reacting to a scary percentage.
How to tell which force is winning
History shows the tug of war can resolve either way. In 2013 the real-yield force won, and gold ground lower for over two years despite strong physical demand. In 2019 the Fed pivoted to cuts, and the structural bulls were rewarded with a breakout.
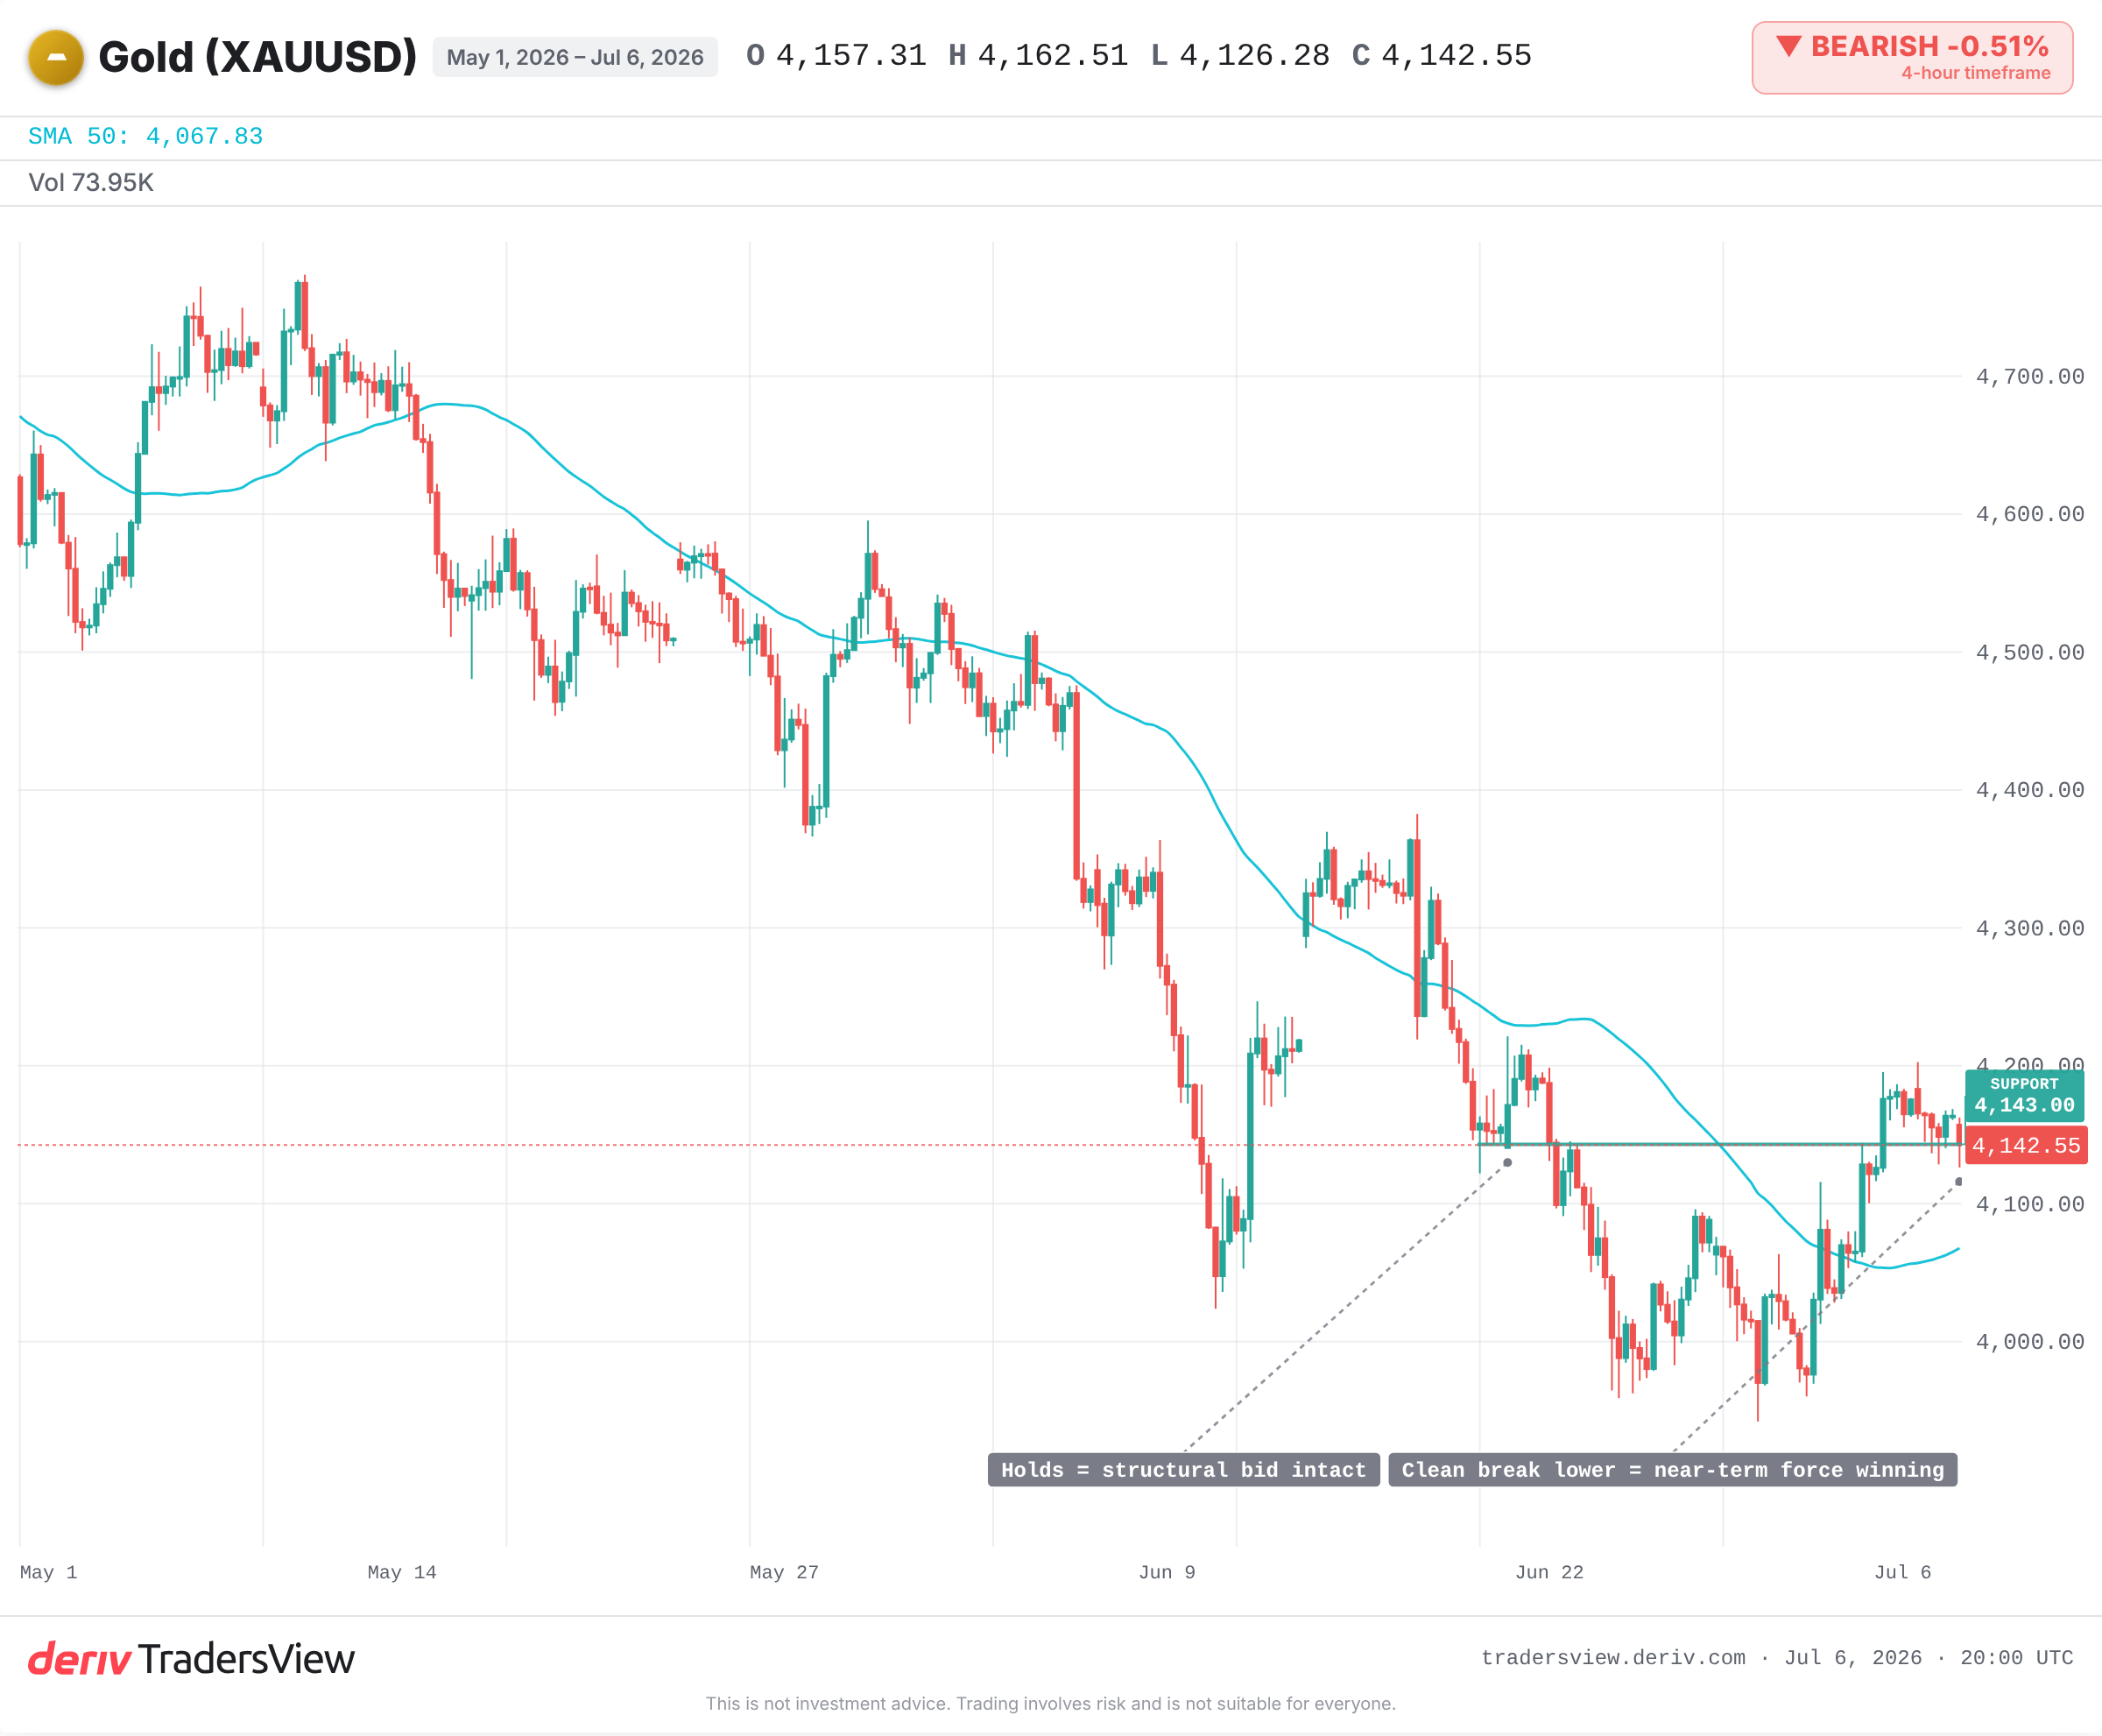
The evidence leans towards the near-term force holding the wheel for now. Watch a few things instead of a target:
- The September Fed decision. A confirmed hike feeds the bear case.
- Real yields. The most direct driver of gold's next move.
- Fund flows. More outflows confirm selling; a turn signals the tide shifting.
- Central-bank buying pace. If official demand stalls, the floor weakens.
- Key chart support. A clean break lower says the near-term force is winning.
Gold could still fall further while the Fed leans hawkish. It could also snap back fast if a hike fails to arrive. Neither camp is wrong. They are measuring different clocks.
Frequently asked questions
Not necessarily. A cut only lowers the forecast relative to a prior view. JPMorgan's reduced target still sits above the current gold price, meaning even the most bearish major bank is projecting upside from here.
Gold pays no interest. When real yields on assets like US Treasury bonds rise, holding those assets becomes more rewarding by comparison, so demand can shift away from gold and pressure its price.
Since 2022, central banks have bought gold at roughly 1,000 tonnes per year, averaging around 60 tonnes a month. This steady official-sector demand is seen as a structural floor under the price.
Gold kept grinding lower into late 2015, roughly halving from its 2011 peak, before basing and recovering. The real-yield force won that tug of war for over two years, even as physical demand stayed strong.
A single target tells you one desk's view, not the market's. When forecasts diverge widely, it signals two opposing forces at work. Watching the drivers, real yields, Fed policy and fund flows, is more useful than trusting one number.