
Bitcoin's decade of gains only paid the holders who never sold
A $10,000 Bitcoin stake in 2015 grew into millions, but only for holders who sat through 80% crashes. Why time in the market beat timing, and what the story hides.
By the Deriv desk · 4 August 2026 · 3 min read
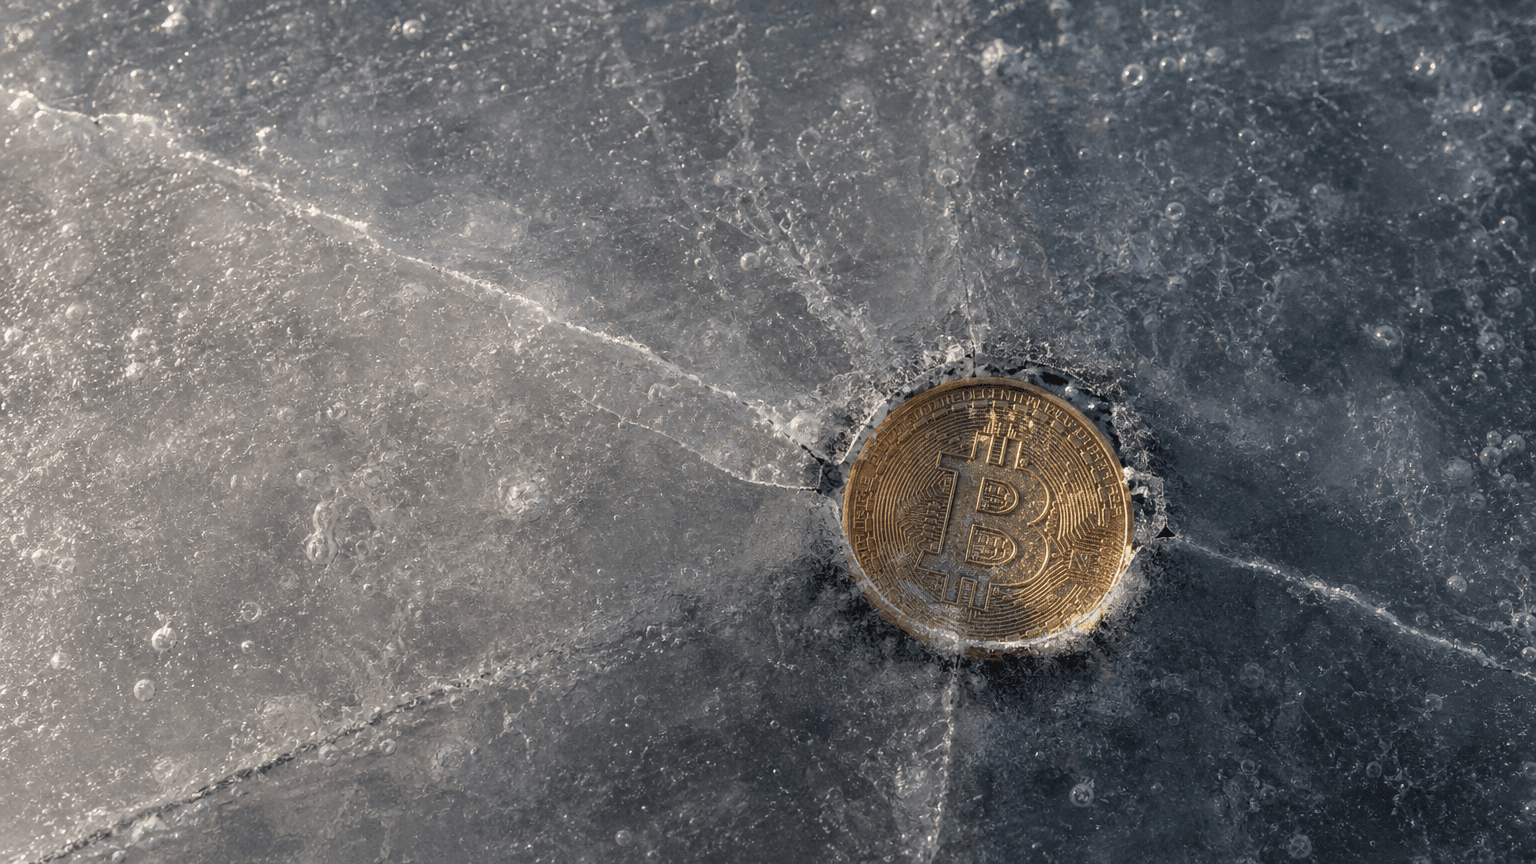
A $10,000 Bitcoin stake in August 2015 bought roughly 43 coins. Held through today, that position was worth well over $2.5 million. The gain came from a decade of patience, not from clever timing.
The maths is real. Bitcoin traded near $230 in the summer of 2015. Ten thousand dollars bought about 43 whole coins. Near recent prices, that stake compounded into a life-changing sum.
Why time in the market beat timing the market
The holder who made that return did one thing well: they sat still. They did not sell the crashes. That is the whole trick, and it is harder than it sounds.
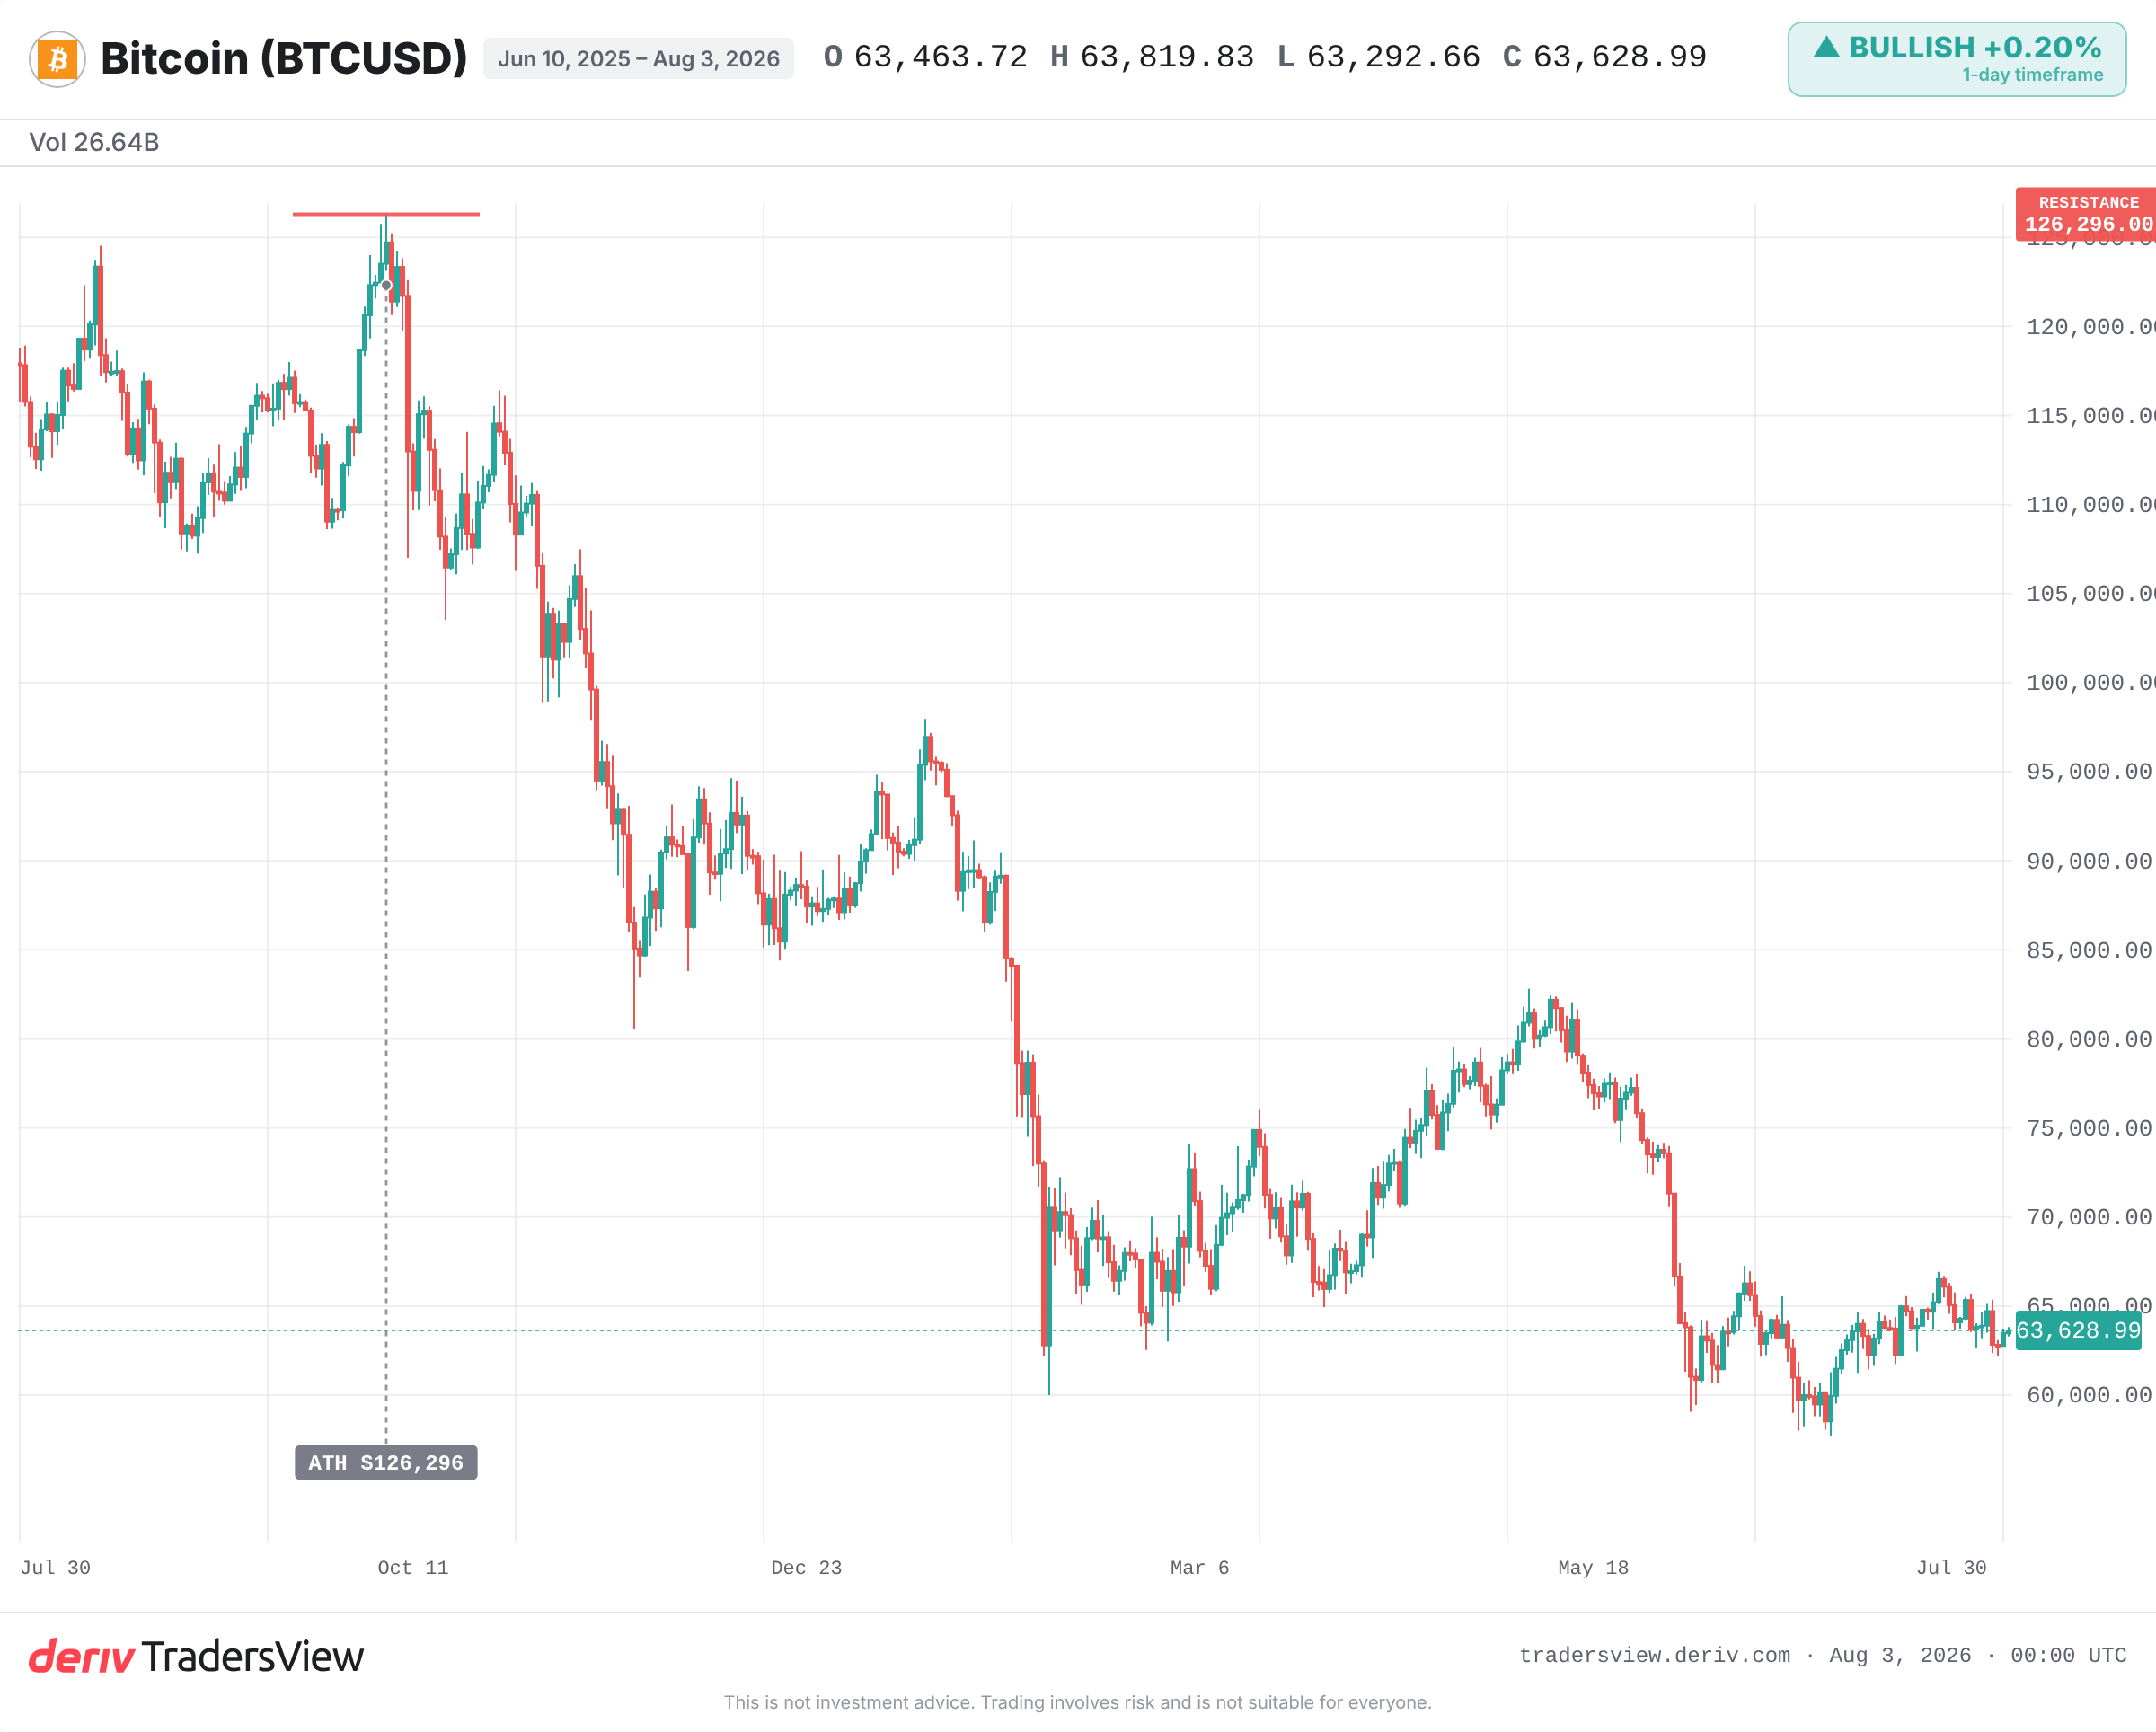
Between 2017 and 2018, Bitcoin ran towards $20,000, then fell roughly 80%. Anyone who bought the top and panicked was wiped out. The decade gain only reached people who held through the wreckage.
It happened again. Bitcoin peaked near $69,000 in 2021, then dropped about 75% to around $16,000 through the 2022 bear market. It later set fresh highs above $100,000 in 2025. Each recovery rewarded the patient and punished the quick.
The reward and the pain are the same coin
The asset that returned thousands of per cent over a decade is the same one that moved roughly $1,500 on an ordinary day.
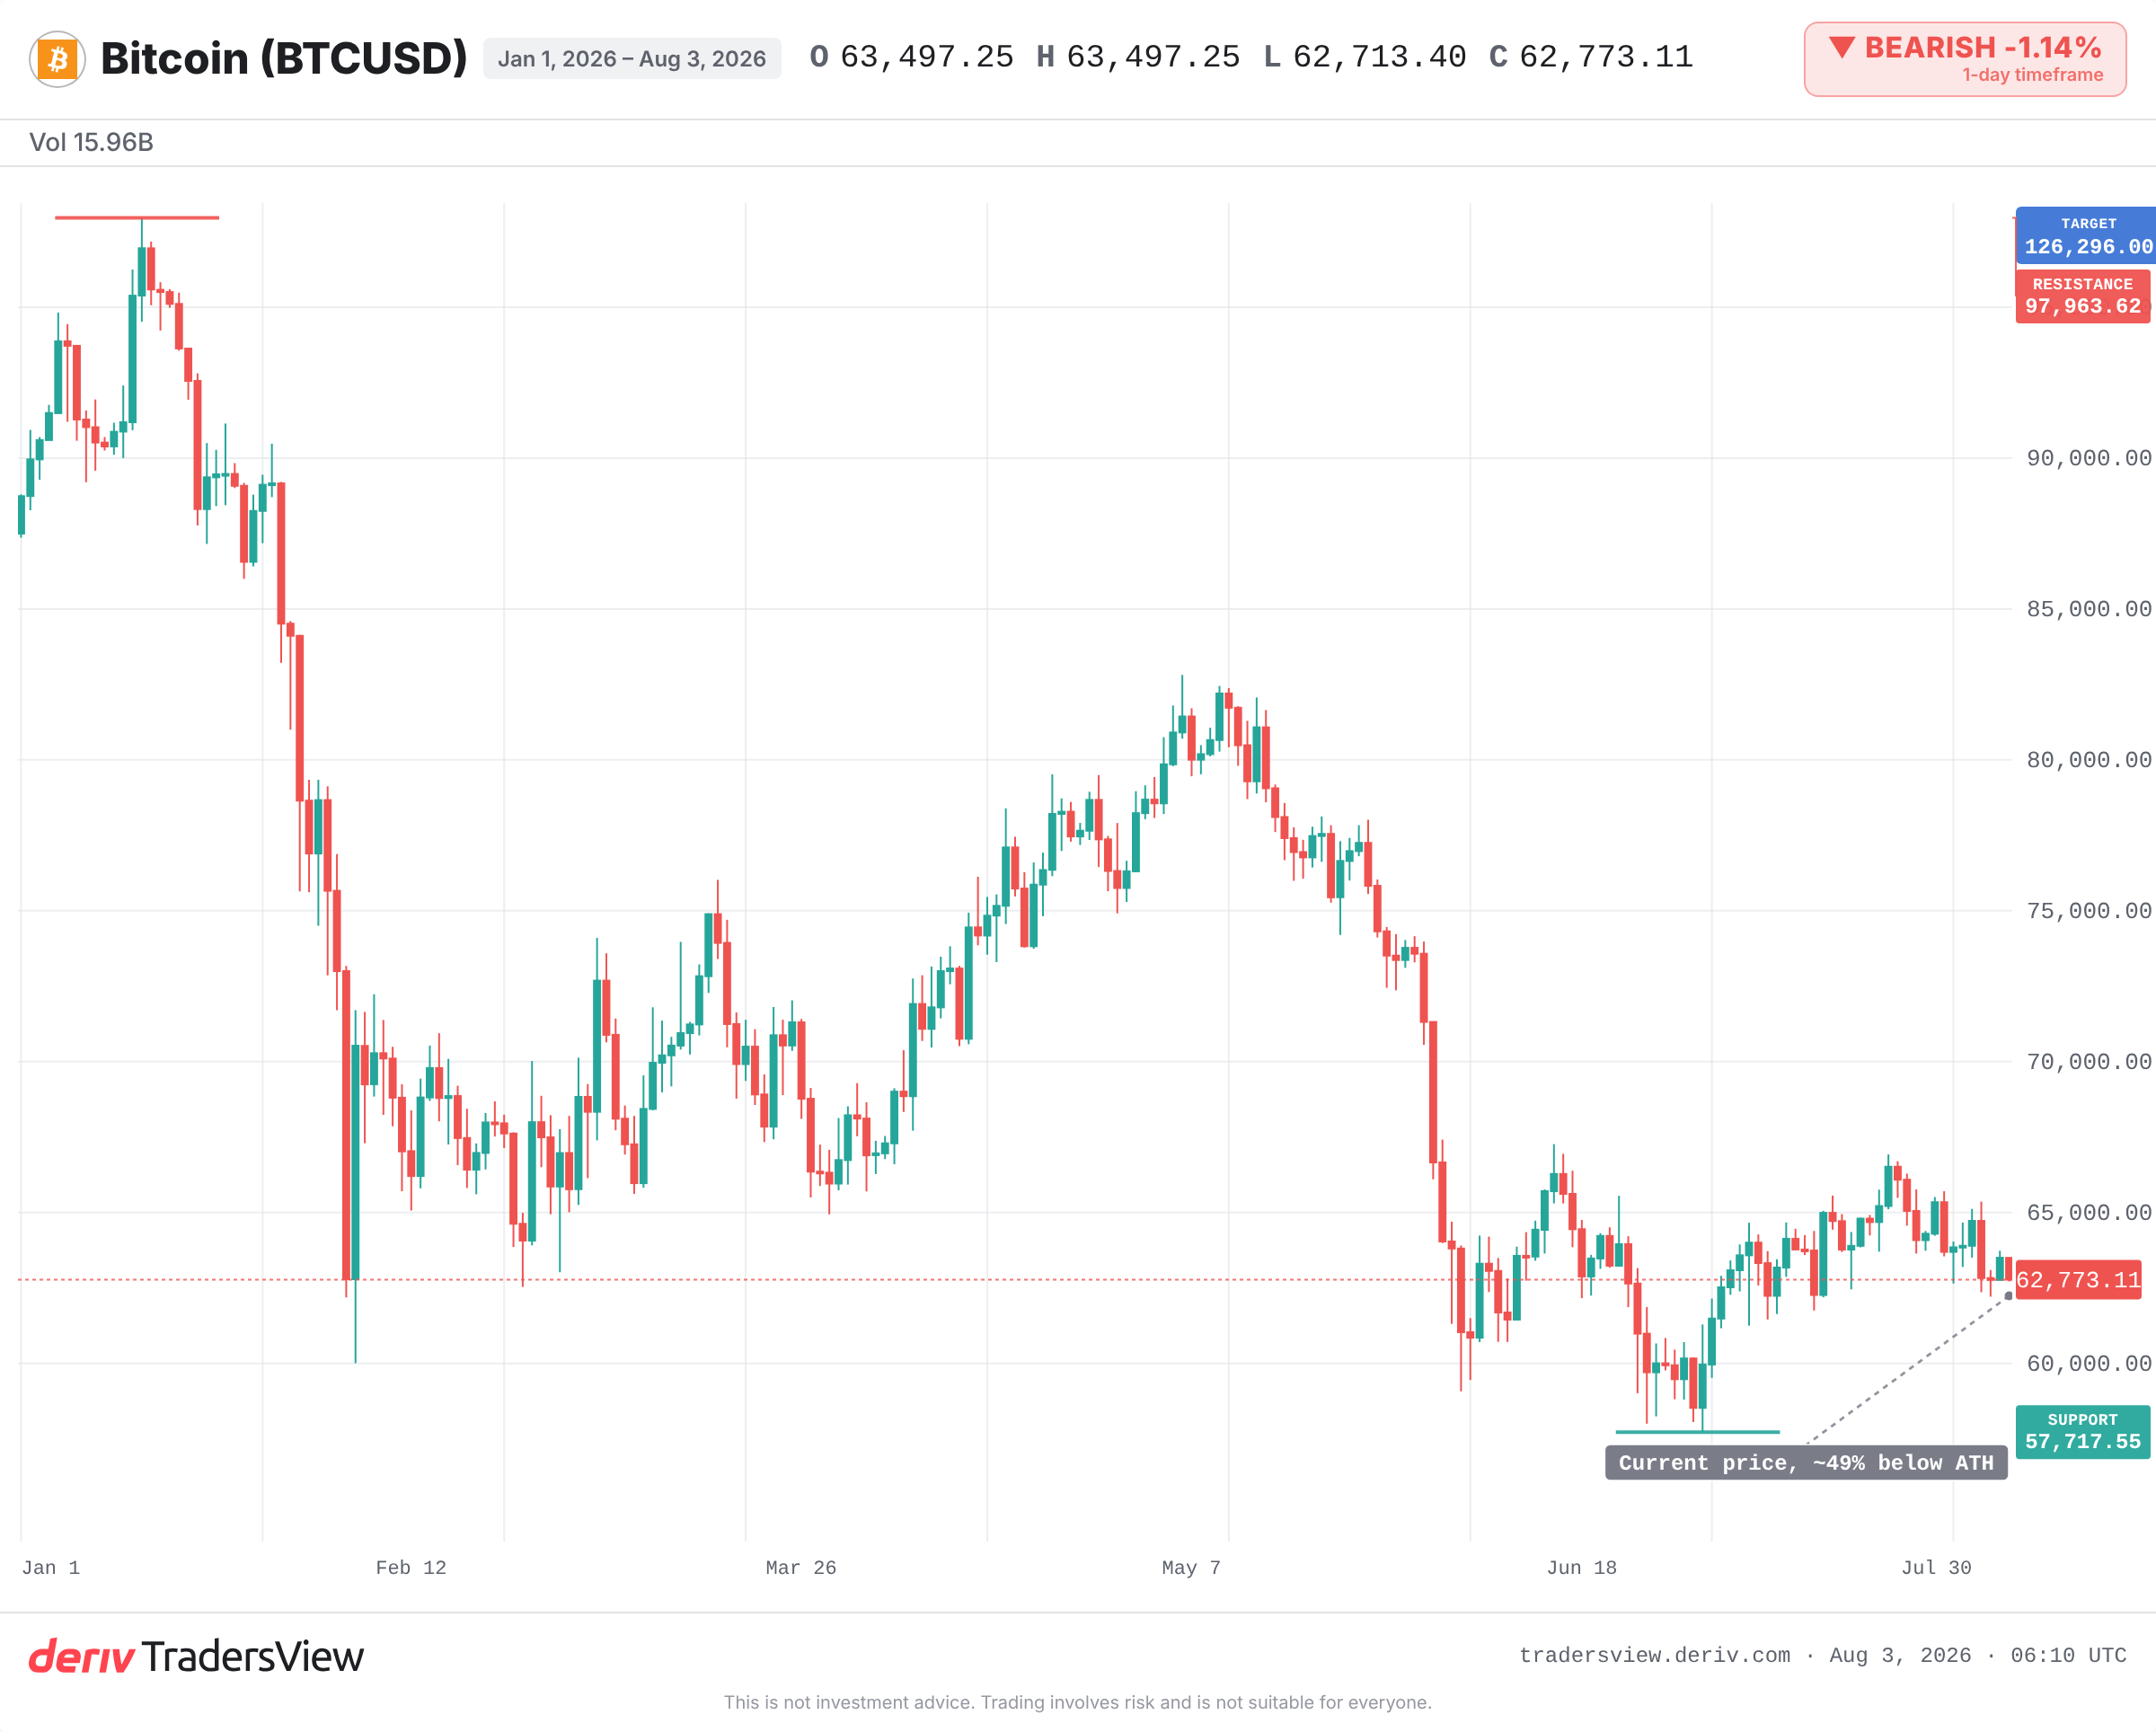
As of late July 2026, Bitcoin's typical daily swing sat near that figure. It also traded roughly 49% below its record high, set last October. This year alone it ranged wide, from the high-$50,000s to the high-$90,000s.
You cannot separate the long-term reward from the short-term whiplash. They are two sides of one instrument. The volatility that made patience so profitable is the same volatility that shook most people out early.
Why the '$10,000 became millions' story misleads
The framing hides a lot. It assumes an investor bought near a decade low, held through 80% crashes without flinching, kept their keys safe for ten years, and chose the one asset that survived.
Most people did none of that. They bought after big runs. They sold in fear. They spread cash across coins that went to zero. The hindsight version quietly ignores every one of those exits.
There is a maths problem too. The 2015 base was tiny, near $230. A repeat of that percentage gain would now require Bitcoin to grow from a multi-trillion-dollar market cap. Past returns from a small base are not a forecast.
What the long-term story asks of you
The decade lesson is genuine, but it comes with a bill. To capture a compounding return, an investor has to survive the drawdowns that scare most holders into selling.
The evidence leans one way: patience, not prediction, produced the outsized gains. That does not make holding safe. A new bear leg could deepen the current drawdown and test that patience for months. A break below this year's low would signal the range is failing. A reclaim towards the upper end would suggest resilience.
Custody failures, exchange collapses and regulation can end a position regardless of the chart. The long-term story only works for money you can leave alone, through the parts that hurt.
Frequently asked questions
With Bitcoin near $230 in August 2015, $10,000 bought roughly 43 whole coins. Near current prices, that position is worth well over $2.5 million, but only for someone who held it untouched for a decade.
It is far harder now. The 2015 gain started from a tiny base near $230. Repeating that percentage would require Bitcoin to grow from a multi-trillion-dollar market cap, so past returns are not a forecast.
A drawdown is the fall from a peak to a later low in an asset's price. Bitcoin has fallen roughly 75% to 80% more than once, which is why long-term gains reached only the holders who did not sell.
High volatility is the price of the long-term reward. Bitcoin can swing around $1,500 on an ordinary day, and those swings are what shake most people out before the recovery, so only money you can leave alone tends to survive the ride.